 Network
Network
Network is a menu bar app for macOS that shows what happens on the Mac's network and on the networks it joins: every connection with the process behind it, listening ports, interfaces and tunnels, Wi-Fi, DNS, the devices on the local network and twenty network tools. It also carries the screens of an application firewall (connection alerts, rules, profiles, blocklists). In this version the firewall does not filter: filtering, the DNS query log and content inspection need a network extension that comes in a later version, and until then those screens are shown, not enforced.
Until version 1.3.3 the app was called Network Manager.
Requirements and installation
- macOS 13 Ventura or later.
- A Mac with Apple silicon (M1 or later). Intel Macs are not supported.
- About 15 MB of disk space.
Installing
- Download the
.pkgfrom leonardoaguiar.com/network. - Open it and follow the installer. It puts the app in
/Applications/Network.app. - At the end, Network opens by itself, with its window (just the bar, every tab closed) and its icon in the menu bar.
Note: Network is not notarized by Apple yet. If macOS stops the installer, open System Settings › Privacy & Security, find the message about it and click Open Anyway. This is only needed the first time.
Installing a new version over an existing one keeps your settings. If the app is running, the installer closes it and opens it again at the end.
Where your data lives
- Settings, the choice of data source and the data-usage counters for today and this month are kept in the app's preferences (
~/Library/Preferences/com.networkmanager.app.plist). ~/Library/Application Support/Network Managerholds the location database (geo.mmdb) once you download it.- Rules, profiles, device names, trust marks and other changes made inside the app are kept in memory only in this version. They are lost when the app quits, and when the data source is switched.
Settings › Data › Show in Finder opens the Application Support folder.
Uninstalling
There is no uninstaller. To remove the app:
- Quit Network with
⌘Q, or the power button in the menu bar panel. - Drag Network from Applications to the Trash.
- To remove the location database too, delete
~/Library/Application Support/Network Manager.
Getting started
On first launch Network:
- opens its window, with just the bar and every tab closed, and adds its icon to the menu bar;
- starts reading this Mac (Settings › Data Source is set to This Mac);
- registers itself to open at login, so the monitor keeps running; turn this off in Settings › General › Launch at login.
It asks for no permission at launch. Each one is requested only when a feature needs it.
Permissions
| Permission | What it is for | When it is asked |
|---|---|---|
| Location | macOS shows Wi-Fi network names and access point addresses only to apps with Location access. Without it, the current network shows as "Wi-Fi network (name needs Location)" and nearby networks without their names. The app never records or sends your location. | Settings › Permissions › Location › Allow… |
| Local Network | Finding the devices on your network. Without it, macOS hides the ARP table from the app, and Devices stays empty. | The first time you click Scan Now in Devices (or Scan the Network on the Dashboard). |
| Administrator | Renewing a DHCP lease, changing the DNS servers, switching network locations, enabling or disabling an interface, packet capture, and the part of Flush DNS that restarts mDNSResponder. | macOS's own password prompt, each time. Cancelling leaves the setting as it was. |
Settings › Permissions also lists Network filter, the system extension that will do the filtering. It is marked Later and is not requested in this version. Network sends no notifications in this version.
The menu bar icon
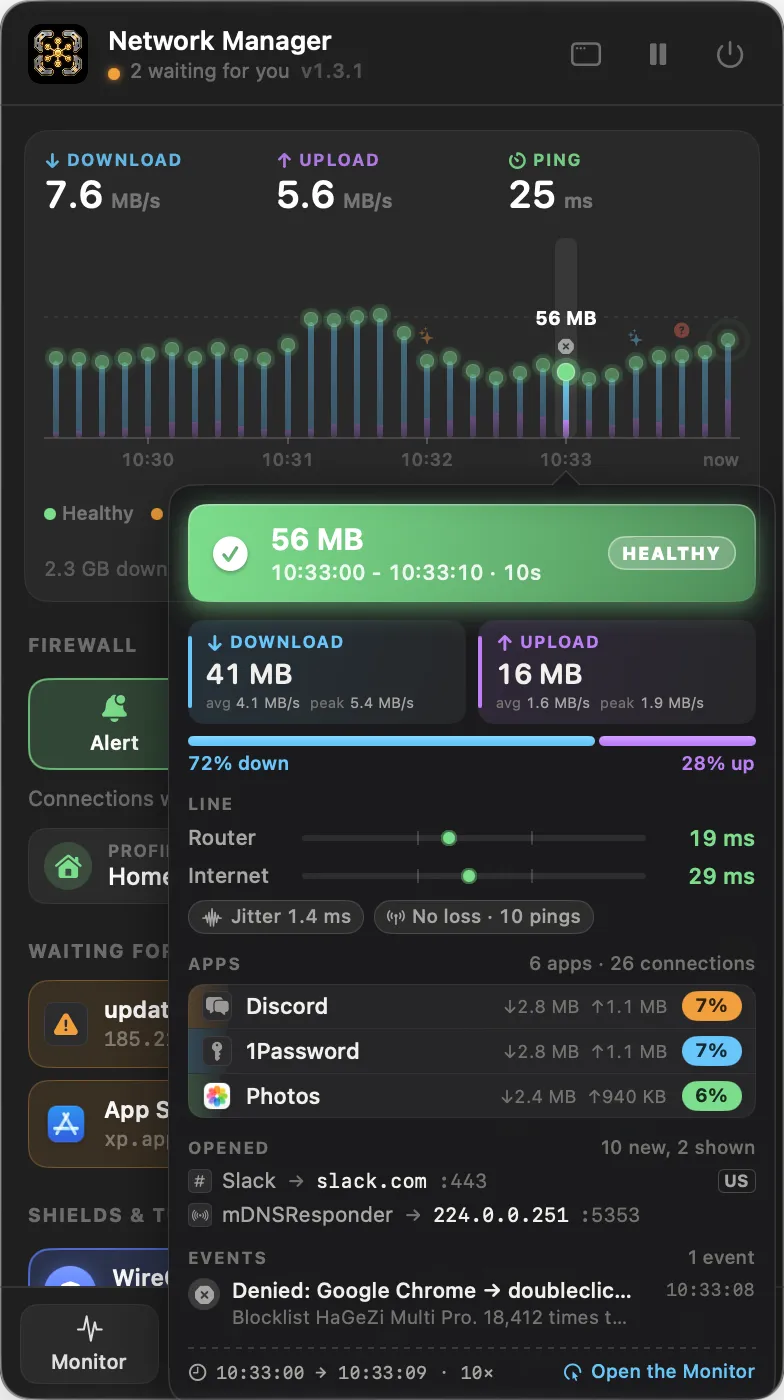
Clicking the icon opens the control panel. A click outside it or Esc closes it. The icon dims while the internet is marked as paused or the kill switch is on.
The panel keeps its size while the numbers change. It shows:
- Header: the state (online with the network name and firewall mode, offline, internet paused, kill switch on, or connections waiting), the version, and three buttons: the window (Open Network), pause or play (Pause the internet / Resume the internet) and power (Quit Network).
- Readouts: download and upload right now, and the ping to the internet (the tooltip adds the router's).
- Timeline: the line over the last 5m, 15m or 1h (the switch under it), in 30 columns of 10 seconds, 30 seconds or 2 minutes. Each column is a stem as tall as the traffic in it, download over upload, with a ball on top in the color of the line's health: Healthy, Slow (round trips above 150 ms to the internet or 50 ms to the router), Loss (pings to the internet unanswered) or Offline; a gray ball is a quiet column, and a faint dash a column with no readings (before Network was running). A mark over the ball shows an event in that column; the busiest column carries its total, and the last one, still filling, pulses. Hovering a column opens its tooltip: the total and the exact interval, the health, download and upload with average and peak rates and their split, the latency to the router and to the internet (min, average and max on a scale from 1 ms to 1 s), jitter, lost pings and time offline, the busiest apps with their share, the connections opened and the events. Clicking a column opens Monitor. Under the timeline: what went each way in the period, and the connections and apps now.
- Firewall: four tiles for the mode (Alert, Silent Allow, Silent Deny, Off) with the mode's description, and two menus: Profile and Snooze alerts (15 minutes, 1 hour, 4 hours, and Alert Again Now while snoozed).
- Waiting for you: connections waiting for an answer, with Deny, Allow and a button for the full alert. Shown only when something waits.
- Shields & tunnels: a tile for each connected or on-demand VPN, Encrypted DNS, Kill switch and Inbound firewall; a click turns it on or off.
- Network: each active interface with its address and rate, and the public address with its provider and place. A click opens Interfaces.
- Recent: the last five events. Clicking one opens the tab it belongs to.
- Footer: tiles to Monitor, Firewall, Devices, Wi-Fi and Tools.
Note: Pausing the internet, the kill switch, the firewall mode, the profile, snoozing and the Encrypted DNS and Inbound firewall switches change what the app shows; in this version they do not block or change any traffic. VPN switches connect and disconnect for real.
The window
The window is a metal bar with nine tabs: Dashboard, Monitor, Firewall, Devices, Wi-Fi, Interfaces, DNS, Tools and Settings. It opens with just the bar, every tab closed (unless it was opened on a page, as from About Network or Report a Bug…). Clicking a tab slides its page down; clicking the open tab again folds it away. Each tab comes back on the page it was on.
- The i button on the title plate, next to the name and version, opens About. About Network in the app menu does the same.
- Search (
⌘F), on the bar left of the close button, finds anything in the app (see Search, below). - The round button at the right end of the bar or
⌘Wcloses the window. Network keeps running in the menu bar.⌘Qquits. - The app shows in the Dock and in
⌘Tabonly while the window is open. - Opening Network again from Finder or Spotlight while it runs brings the window up. Only one copy runs at a time.
Most tabs have a sidebar with their pages, a toolbar with a button that hides the sidebar (⌃⌘S), a filter field and the tab's own controls. The marking under the sidebar reads "live · this Mac." when the app reads the Mac and "preview · simulated data." with sample data.
The menus at the top of the screen are the app menu - About Network, Documentation, Check for Updates…, Stack Windows (see With the other Mac apps), Report a Bug… and Quit Network (⌘Q) - and Help, with Network Documentation, Changelog and Report a Bug….
Search
Search on the bar, or ⌘F anywhere in the window, opens a page with one field over everything in the app: every page of every tab, the options on them (firewall modes and shields, inbound and lock settings, the hotspot, proxies, 802.1X and sharing, encrypted DNS), the twenty tools, every setting, the Dashboard's sections and quick actions, and the help pages. It searches what the app offers, not what it sees: connections, servers and devices are found by the search on the Dashboard and the filter field in each tab.
- With nothing typed, it lists all of it, by tab.
- Typing narrows it to the best matches; case and accents don't count, and every word typed has to match. The matching part of each name is lit.
- Click a result, or move with
↑↓and pressReturn: it opens the tab on the right page, scrolls to the option and lights it for a moment. An action (Check for Updates…) runs right away. Escapeclears the field, then closes the page. Clicking Search again closes it too.
What is real in this version
Read from this Mac: every connection with its process, bytes, state, interface and round-trip time; who each process is (path, bundle, user, parent chain, arguments, signature, Team ID, entitlements, SHA-256, where it came from); listening ports; interfaces with addresses, lease, DNS and counters; the router, routes and ARP table; the Wi-Fi radio and the networks around; VPN configurations, network locations, proxies, saved Wi-Fi networks and the hosts file; the devices on the network; health checks; and every tool except Mac to Mac.
Not yet: filtering (the alert, rules, profiles, blocklists, inbound rules, kill switch, pause), the DNS query log, content inspection, packet detail and TLS handshakes. Screens about those show a line saying so when the app reads the Mac, and many of their controls only change what is shown.
What runs in the background
While Network runs and reads this Mac, it:
- reads every socket once a second, and the interfaces, routes, ARP table and DNS settings every five seconds, without administrator rights;
- keeps two pings going, to the router and to 1.1.1.1, once a second, for latency and packet loss;
- runs the health checks about every 30 seconds (pings to the router, 1.1.1.1, 8.8.8.8 and leonardoaguiar.com);
- looks up the reverse DNS name of each remote address, through the Mac's resolver;
- counts the bytes through the primary interface for data usage.
Nothing it reads is sent anywhere. Monitoring only happens while the app runs.
Keyboard shortcuts
| Shortcut | Action |
|---|---|
⌘, | Open Settings |
⌘W | Close the window (the app keeps running) |
⌘Q | Quit Network |
⌃⌘S | Hide or show the sidebar |
⌘F | Search everything in Network |
⌘Return | Run the open tool (Tools) |
Esc | Close the menu bar panel or the connection alert |
The connection alert has its own shortcuts (see The connection alert, under Firewall). In text fields, ⌘X, ⌘C, ⌘V, ⌘A, ⌘Z and ⇧⌘Z work as usual.
Dashboard
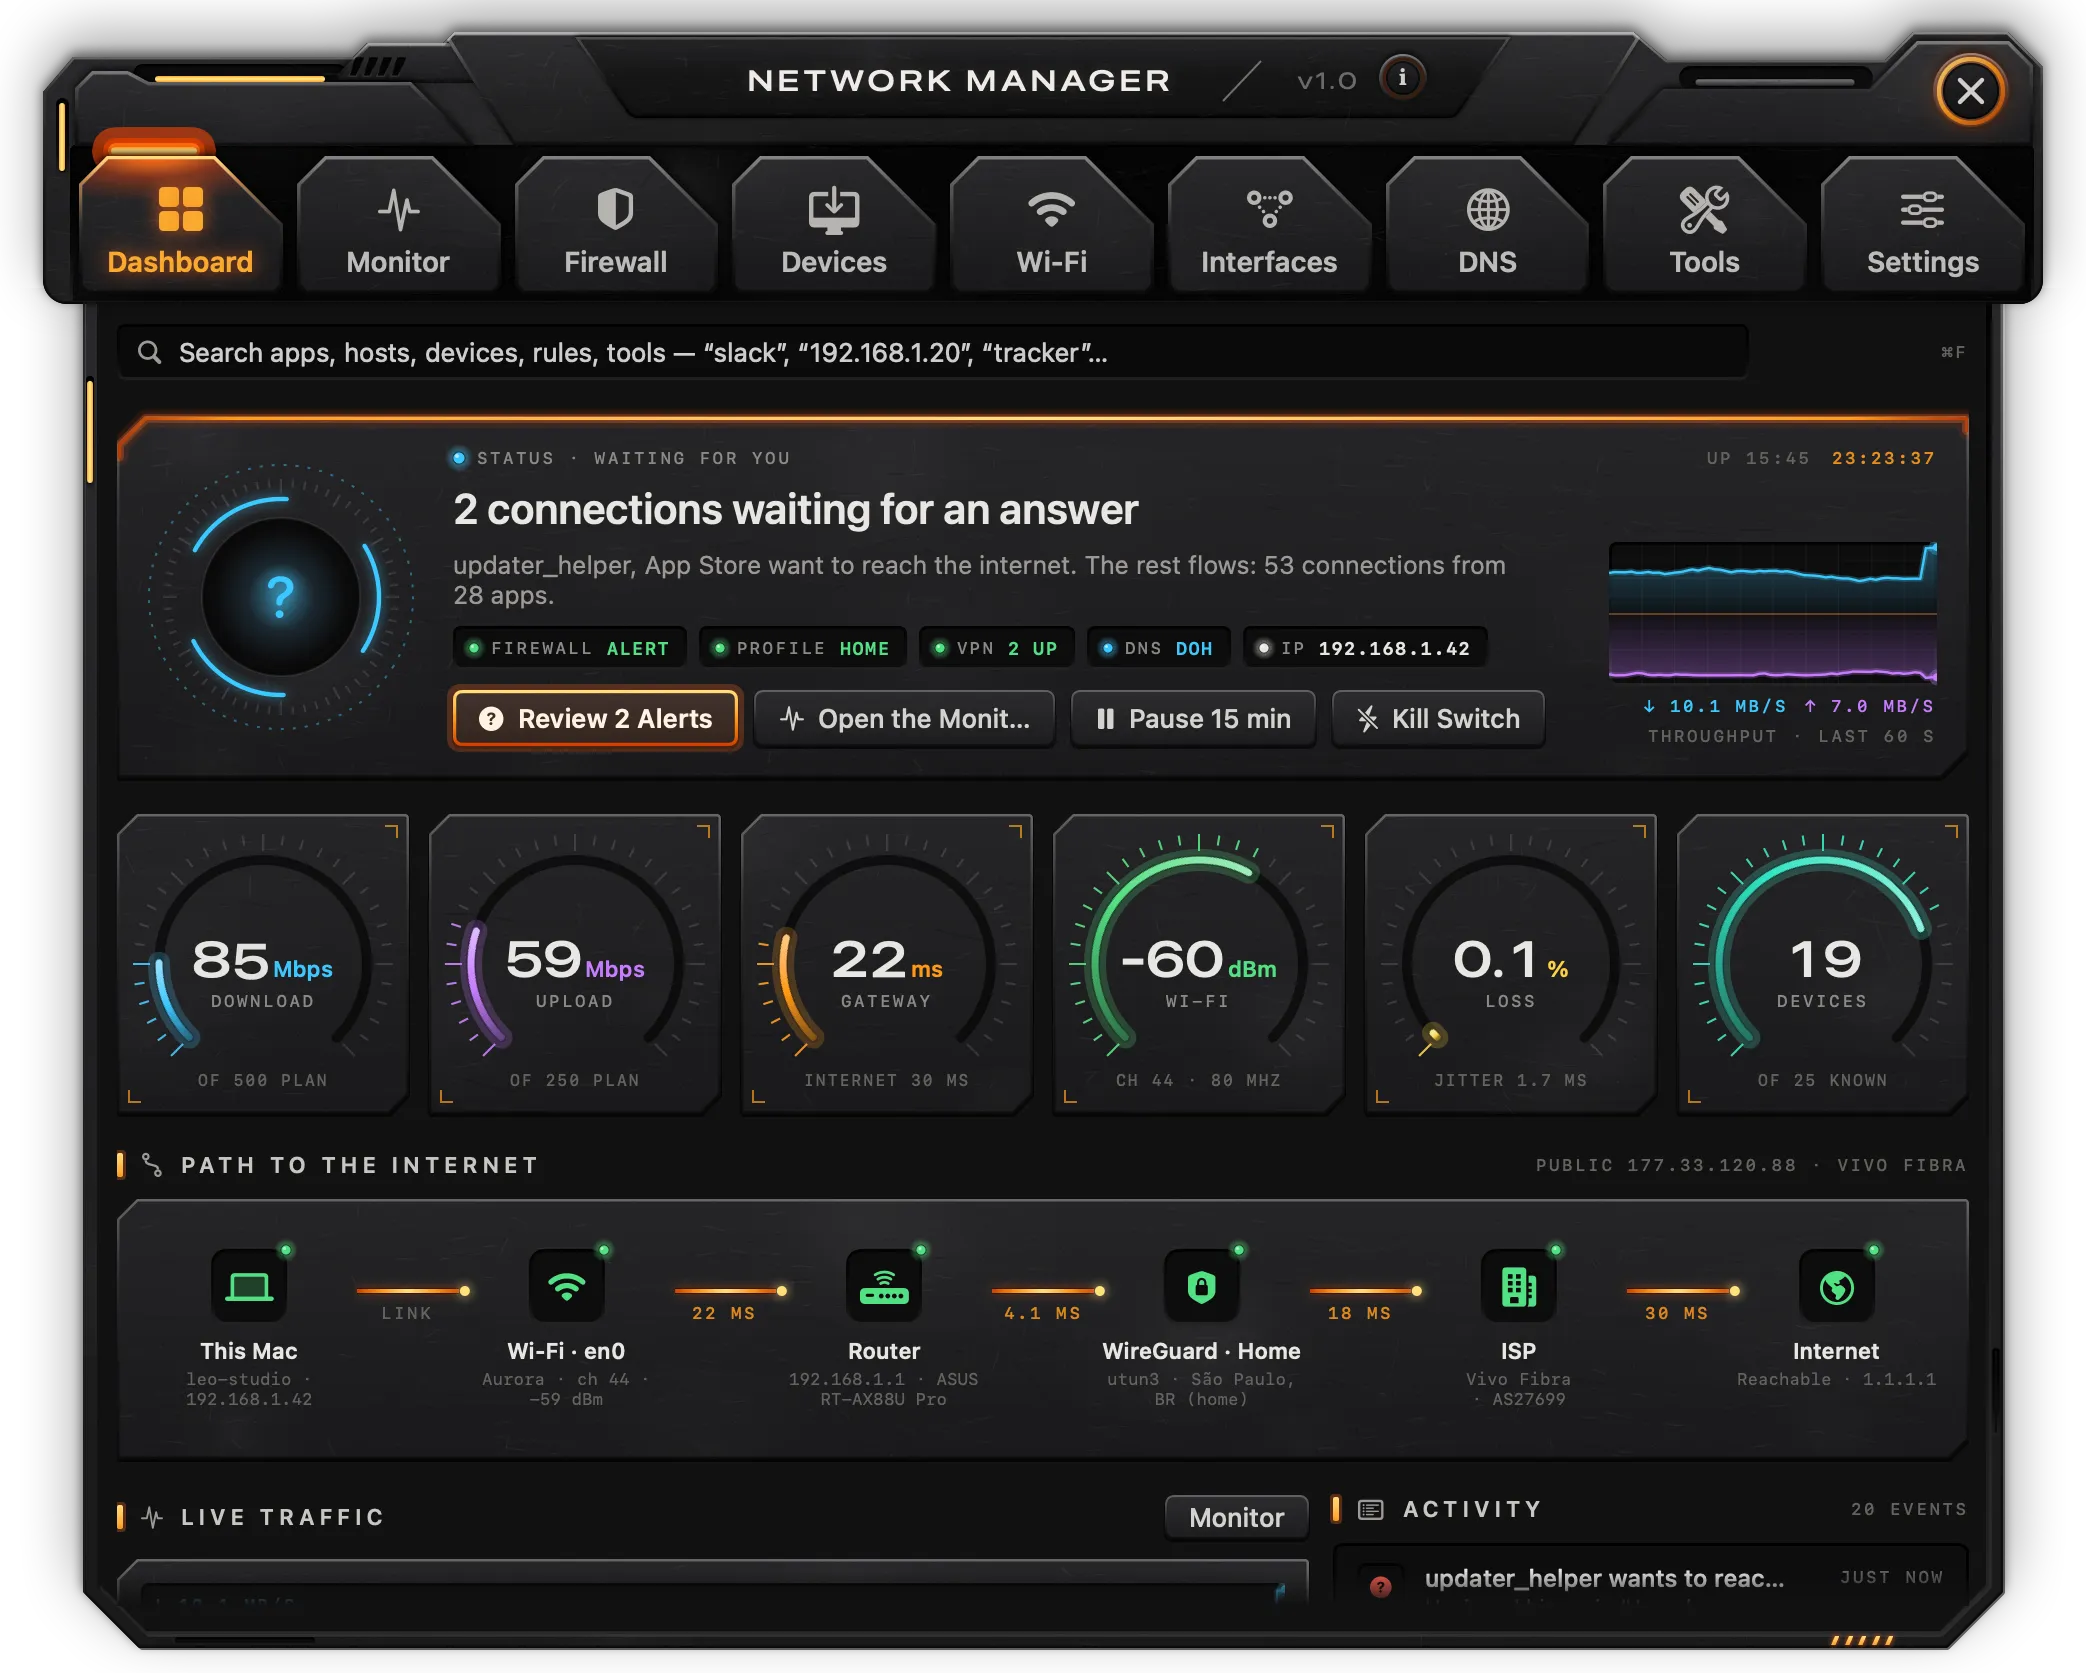
The Dashboard puts the state of the network on one page.
Search
The field at the top searches apps, servers, connections, devices, rules, Wi-Fi networks and tools at once. A server name, an IP address or a process ID also finds the connections it matches, listed as "Dossier · App → host:port"; picking one opens its dossier. Picking any other result opens it in its tab. Up to 30 results are listed.
Status
The plate under the search shows the current state:
- online, with the network and the counts of connections, apps and devices;
- connections waiting for an answer, with Review N Alerts;
- internet paused, or kill switch on.
Readouts give the firewall mode, the profile, the number of connected VPNs, how DNS travels and the Mac's local address. Beside them, the throughput of the last 60 seconds and the uptime of the Mac.
Buttons:
- Open the Monitor.
- Pause 15 min / Resume: marks the internet as paused for 15 minutes.
- Kill Switch: asks "Stop all traffic?" and turns on with Stop Everything. Click again to turn it off.
Note: In this version pausing and the kill switch change the status shown; they do not block traffic.
Dials
Six dials: Download and Upload (current rates), Gateway (latency to the router, with the internet's latency under it), Wi-Fi (signal in dBm), Loss (packet loss to 1.1.1.1 over the last minute, with jitter) and Devices (online devices out of the known ones).
Path to the Internet
The way out, node by node: This Mac, the interface in use (Wi-Fi with the network, channel and signal, or the wired link), Router with its latency, the tunnel if a VPN is connected (otherwise "No tunnel"), ISP, and Internet (reachability of 1.1.1.1). The public address and provider in the caption appear after Tools › Public IP, the speed test or a leak test has run. Each node opens where it lives: Interfaces, Wi-Fi, Devices (the router), Interfaces › VPN, Tools › Traceroute and Tools › Ping.
Live Traffic and Activity
Live Traffic draws the last 5 minutes of download and upload and lists the six apps using the most (top talkers). Clicking an app opens it in Monitor › By App; Monitor opens the Monitor.
Activity lists the latest events: the app starting to read the Mac, going offline and back, interfaces going up or down, new devices, unsigned processes reaching the network, tools finishing, changes you make. Clicking an event opens its tab.
Quick Actions
- Speed Test: runs the speed test and opens it in Tools.
- Scan the Network: scans for devices and opens Devices.
- Flush DNS: clears the system's DNS caches (asks for an administrator password for mDNSResponder).
- Renew DHCP: renews the lease on
en0(asks for an administrator password). - Test Alert: shows the connection alert with a sample connection.
Data Usage and Protection
Data Usage shows the traffic of today and this month, and today's download and upload. The counts come from the primary interface while Network runs and are kept across launches. Details opens Monitor › Data Usage.
Note: The monthly cap bar, the reset date, the projection and the per-interface rows under it are fixed figures in this version; they don't follow your usage or Settings › Monthly data cap.
Protection shows queries blocked today, trackers seen right now, the number of rules, and the state of the firewall mode, blocklists, encrypted DNS, inbound firewall, tunnel and configuration lock. Firewall opens the Firewall tab.
Monitor
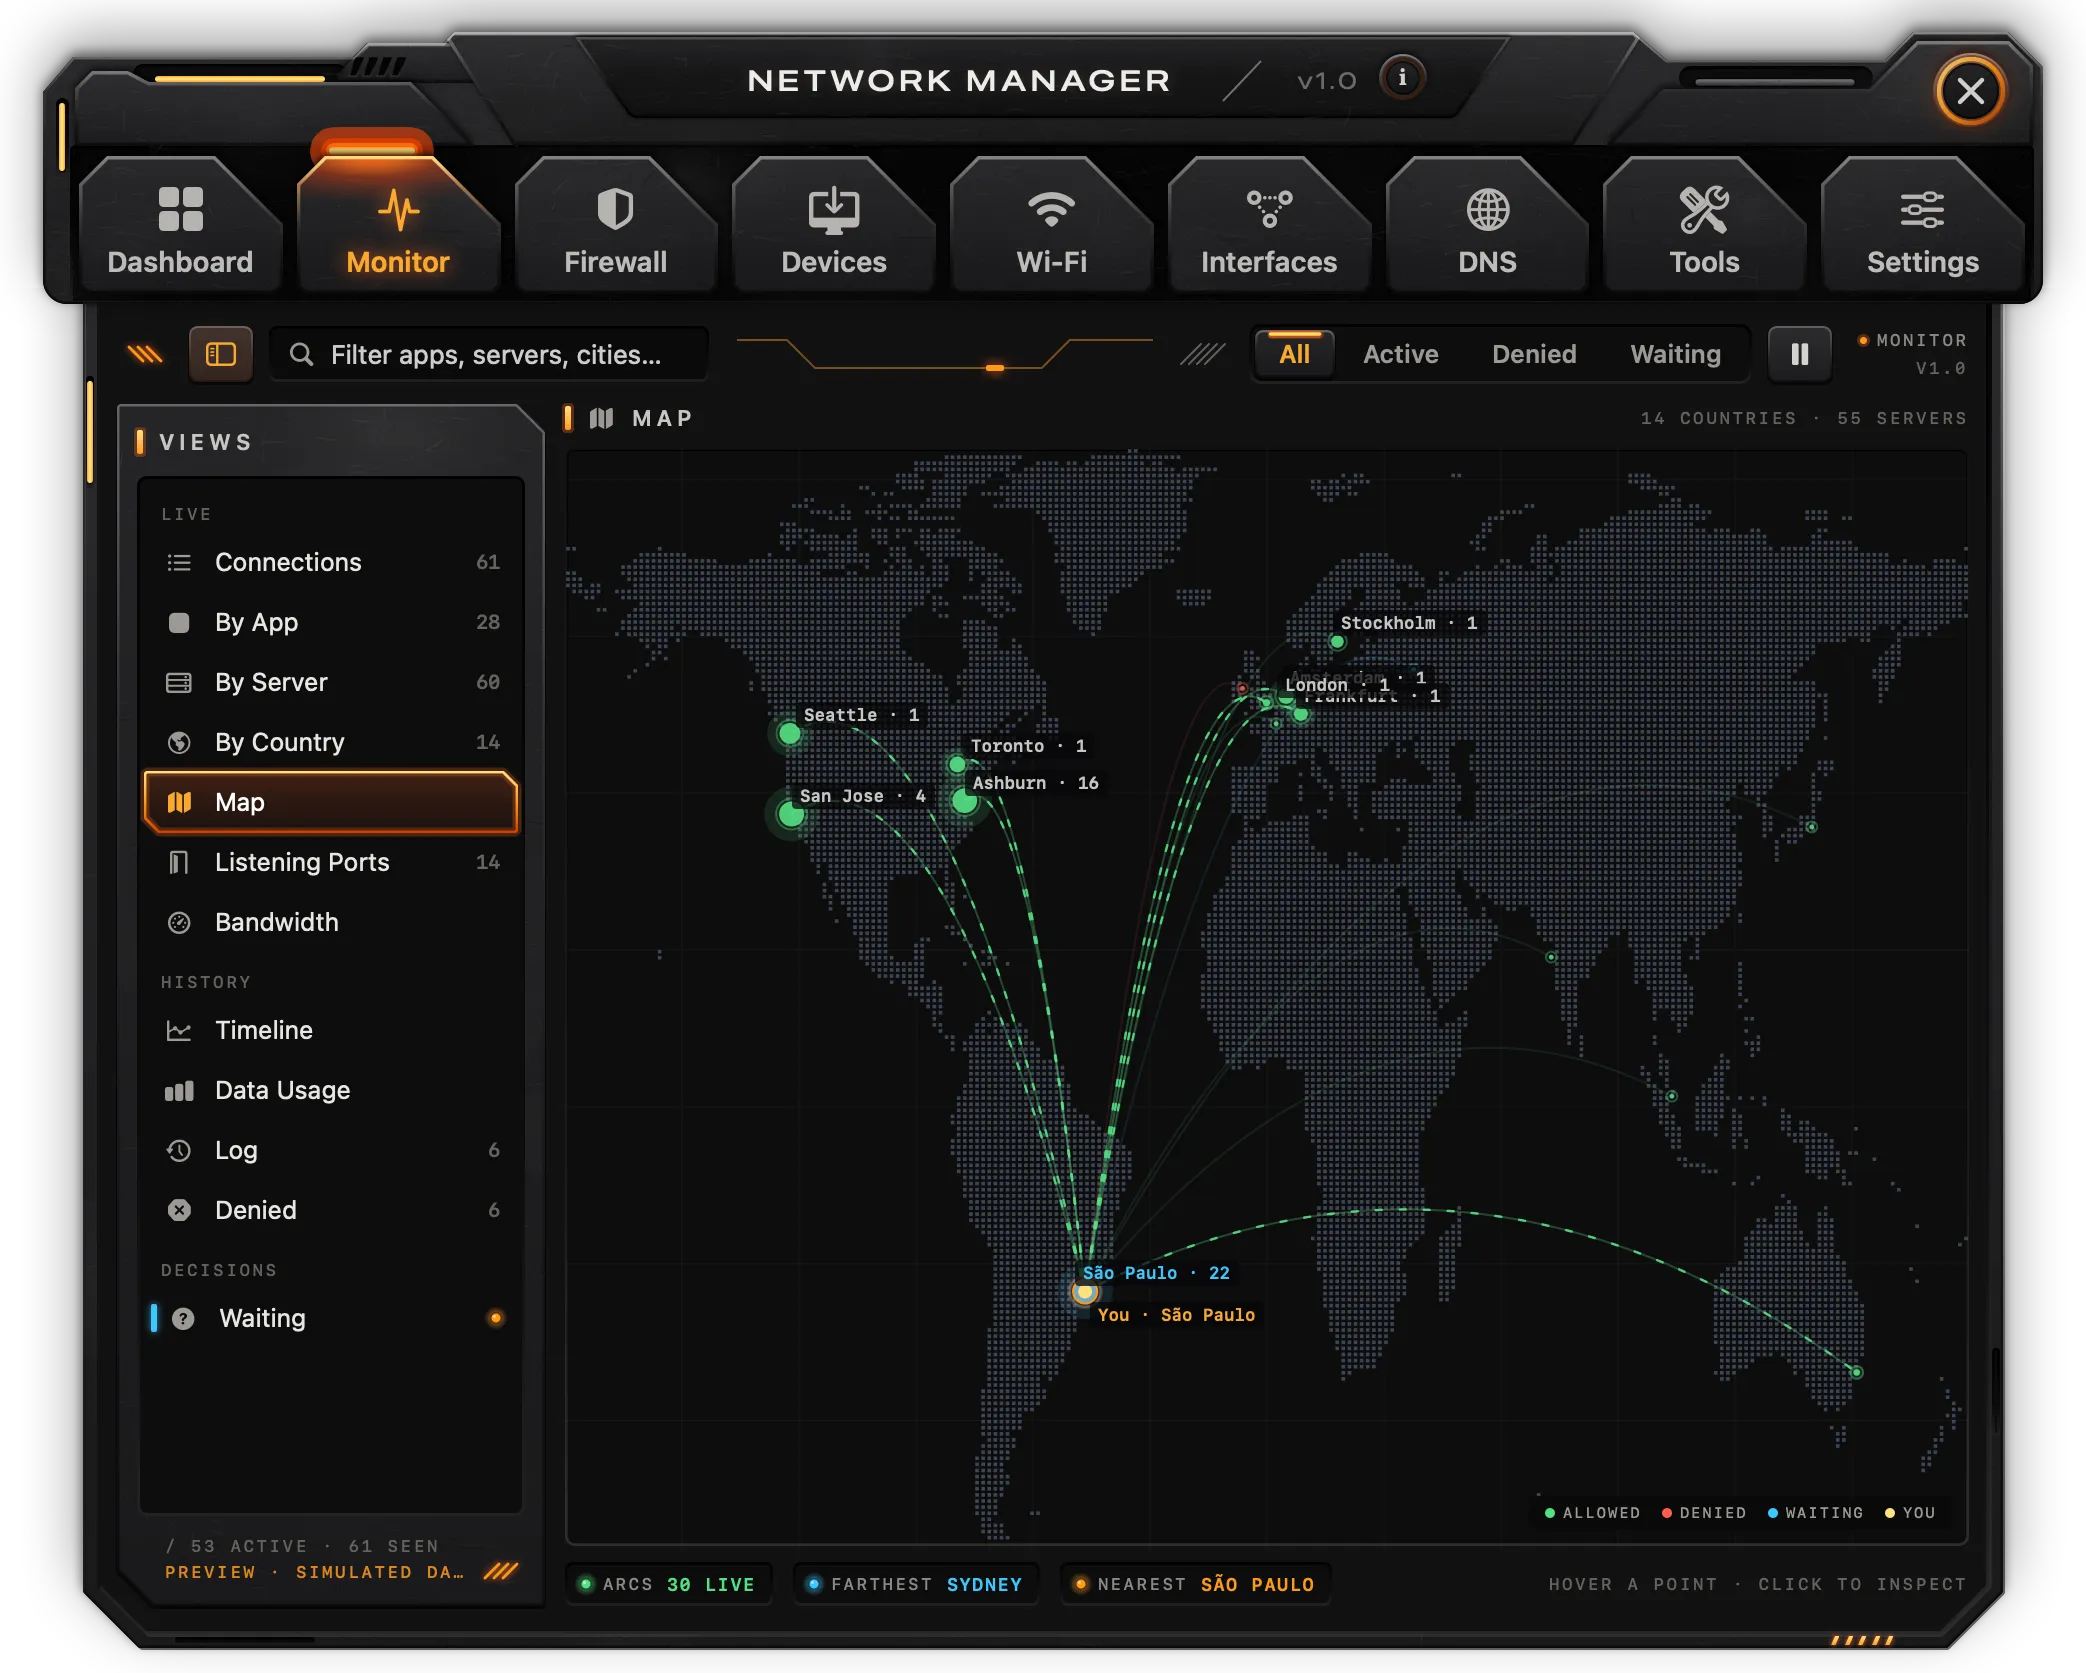
The Monitor lists every connection of every process, read once a second. Its sidebar has the pages Live (Connections, By App, By Server, By Country, Map), Forensics (Processes, Streams, Listening Ports, Bandwidth), History (Timeline, Data Usage, Log, Denied) and Decisions (Waiting).
The filter field narrows the lists by app, server, address, city or category. The toolbar has the filter All, Active, Denied, Waiting, and a pause button that freezes the list so it can be read (Freeze the list to read it); click it again to resume.
Connections to the Mac itself (127.0.0.1) are left out unless Settings › Show loopback connections is on.
Connections
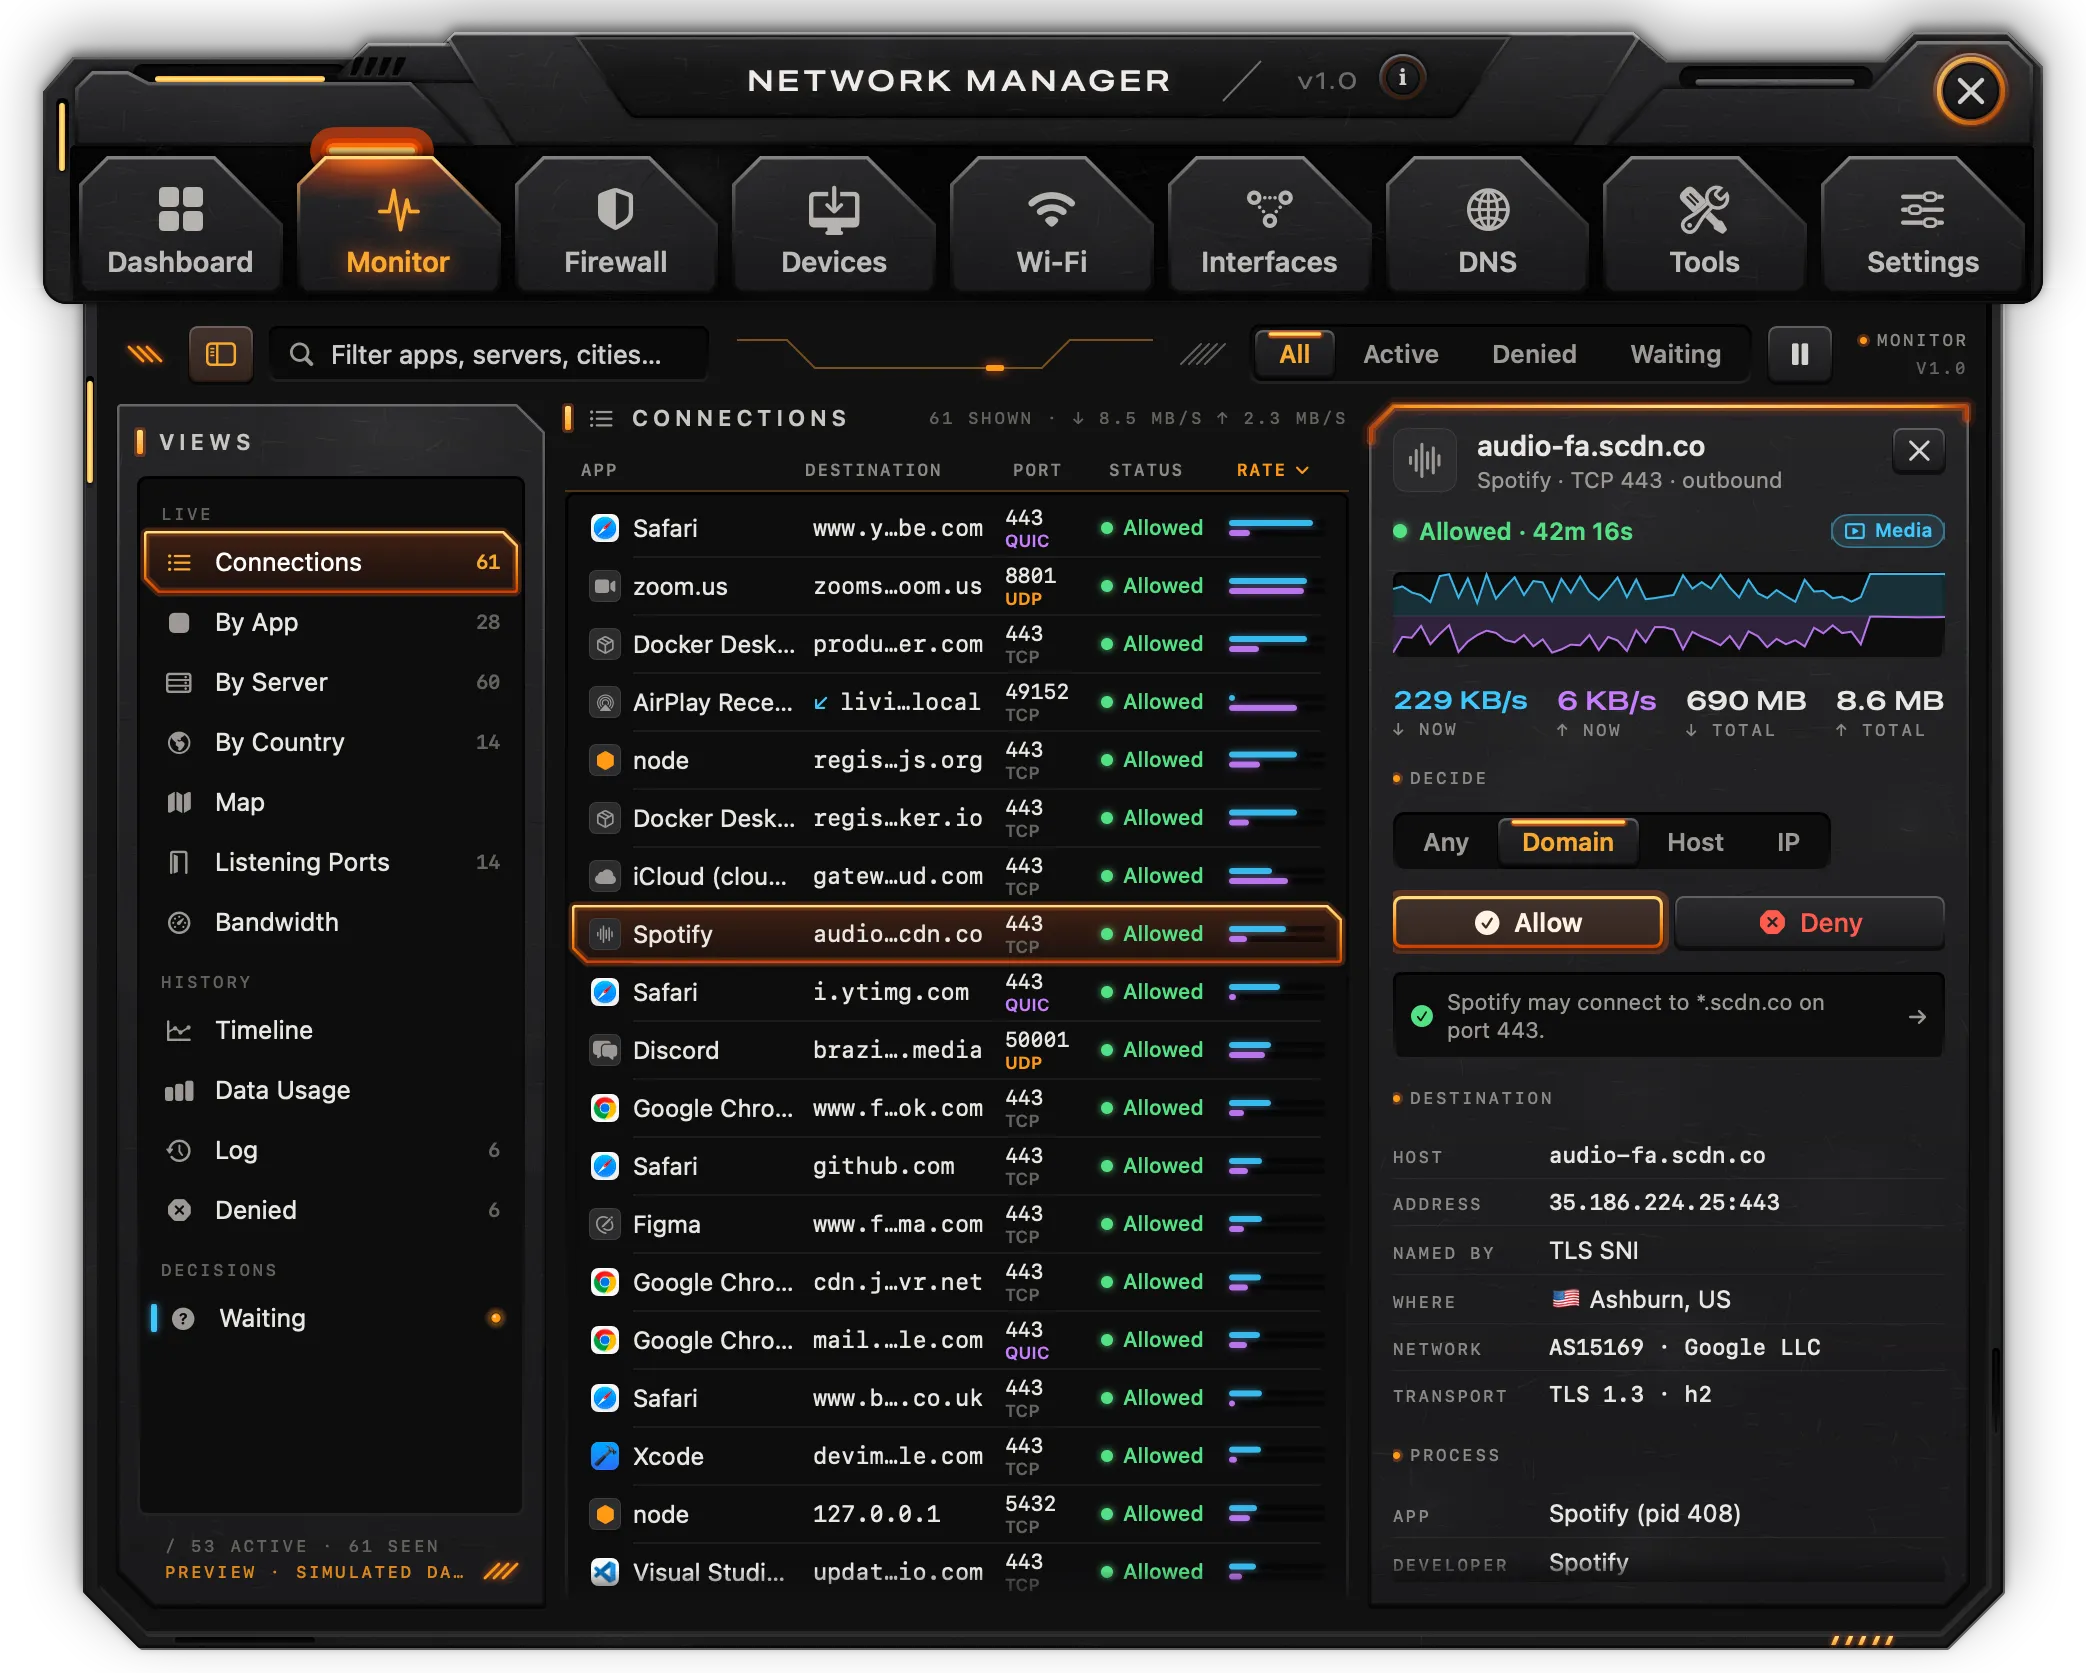
One row per connection: App, Destination (name, address and city, or "LAN"), Port and protocol, Category, Status, Rate, Total and Age. Click a column header to sort; click it again to reverse. Closed connections are dimmed.
- The name of a server comes from its reverse DNS record when there is one.
- The category (API, CDN, Tracker, Telemetry, Ads, Media, Updates, Sync, Mail, Social, Developer, Local, Unknown) comes from a built-in list of domains, then from the port.
- The city and country need the location database (Settings › Data Source › Location database); without it, servers show as Unknown.
- Whether a connection is encrypted is judged by its port ("TLS · by port") or protocol (QUIC).
Clicking a row opens the inspector beside the list:
- the status, the category and Open the dossier;
- a graph of the last minute and the current and total bytes in each direction;
- Decide: a scope (Any, Domain, Host, IP) and Allow or Deny, which create a rule; the rule that matches, if any, opens with a click;
- Destination: host, address, how the name was found, place, network and transport;
- Process: app and PID, developer (in red when unsigned), path, local interface and port, start time;
- More: All from the app, Look up, Trace, Copy address.
Note: Allow and Deny record a rule and mark the connection; nothing is blocked in this version.
By App, By Server and By Country
By App rolls the connections up per app: connections, a traffic meter, speed, total, and flags for waiting, denied and unsigned. The inspector shows the share of each category (with how many go to trackers, ads or telemetry), Allow all, Deny all, Deny trackers, ads and telemetry, the app's connections, its bundle and path, Rules and Show in Finder.
By Server rolls them up per server: where it is, category, the apps that reach it, rate and total. The inspector lists the apps that reach it, Allow domain and Deny domain, Look up, Certificate and Trace.
By Country lists countries by traffic, leaving the local network out, with the share of the top eight and the countries denied by rules. The flag button on each row opens the firewall rules for that country.
Map
A world map with a point for each place servers are in, and arcs for live connections. Hover a point to see its connections; click one to open the inspector. Readouts give the number of live arcs and the farthest and nearest cities.
Servers appear on the map only with the location database installed. This Mac is placed from its public address, so its point ("You") appears after Tools › Public IP has run. A line at the bottom of the map says which of the two is missing. Settings › Animate the map turns the arcs' movement off; it also stays still with Reduce Motion.
Dossier
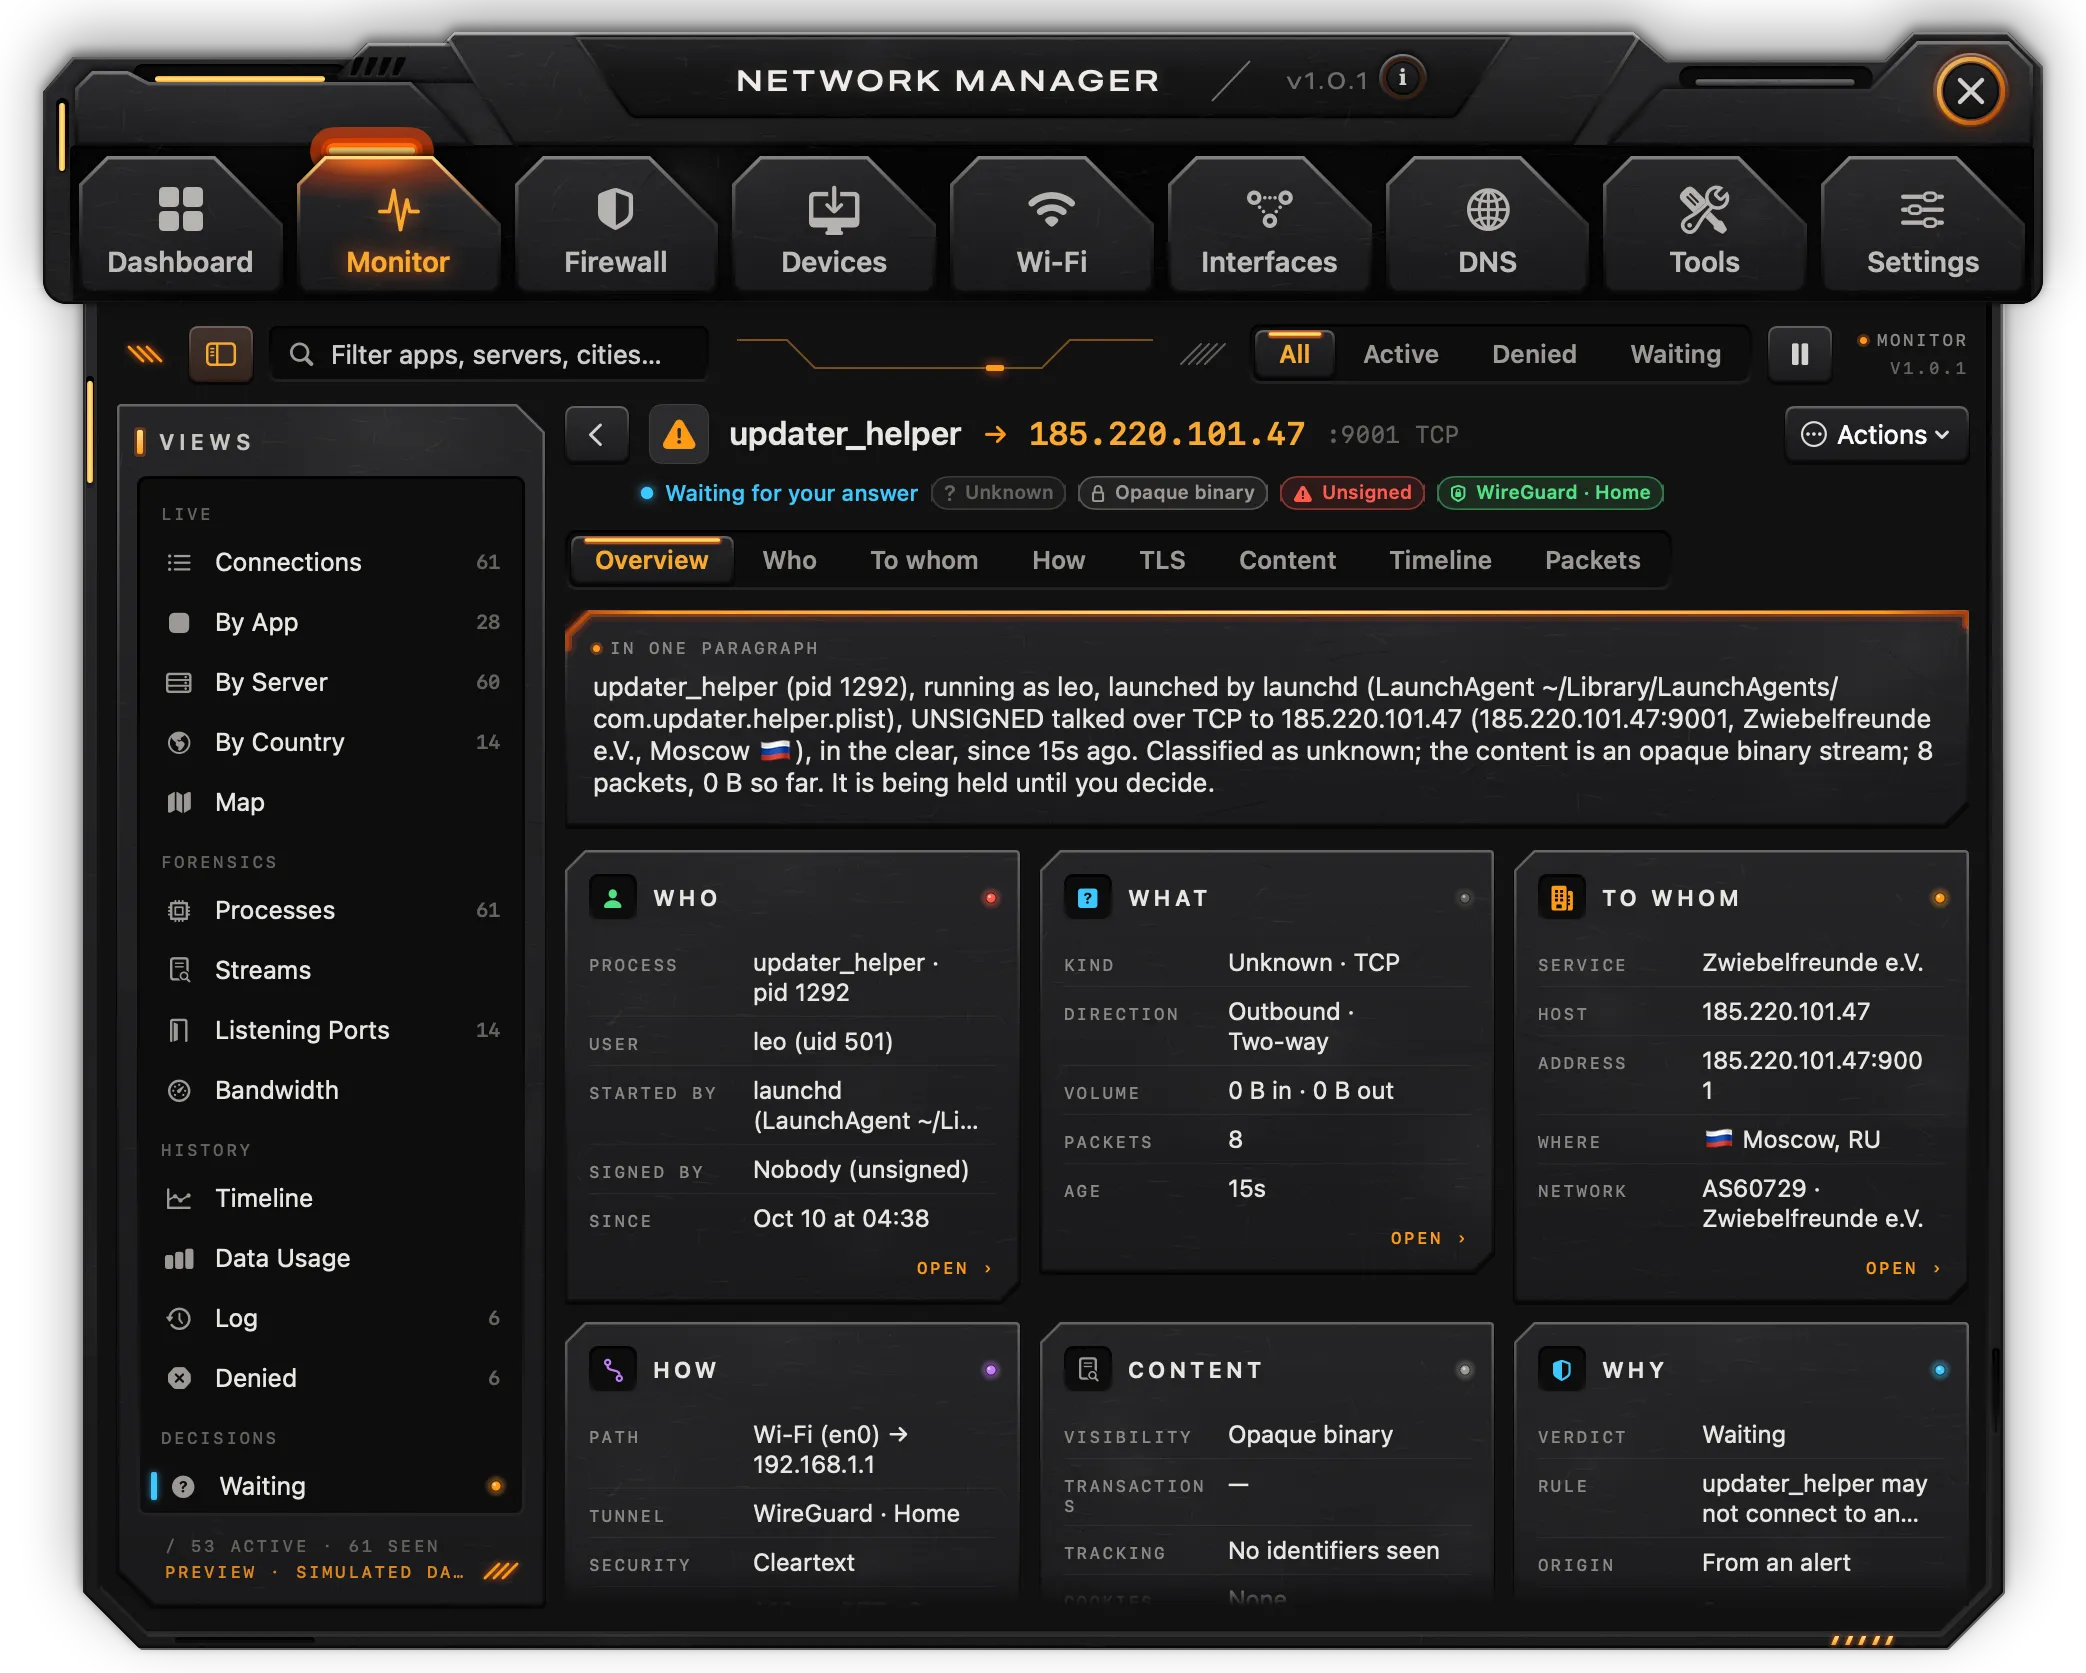
The dossier is everything known about one connection. It opens with Open the dossier in an inspector, the dossier button in Processes, Open the dossier in Streams, or a search on the Dashboard. The arrow at the top left goes back to the list.
The header shows the app, the server, the status, the category, the visibility and any tunnel. Actions offers Allow this host, Allow the domain, Deny this host, Deny the domain (rules, not enforced) and Copy dossier as text.
Eight tabs:
- Overview: the connection in one paragraph (who, to whom, how, how much, and whether a rule matches), then six cards (Who, What, To whom, How, Content, Why) that open their tabs, and a privacy note.
- Who: the lineage from launchd down; the signature chain, Team ID, identifier, hardened runtime, sandbox and SHA-256; the process's name, PID, user, path, bundle, version, install date, source (for example Homebrew or the site it was downloaded from), start time and what launched it; CPU, memory, threads and sockets right now; its arguments and entitlements. Buttons: All connections of this process, Rules for the app, Show in Finder, Copy SHA-256.
- To whom: service, hostname, address and port, reverse DNS, where it is hosted, category, any country rule, a reputation score, the apps that also talk to it, and the map. Buttons: Lookup, Trace route, Ping, Certificates, Every connection to this host.
- How: the local address, interface, route, gateway and tunnel; round-trip time and its variation, window, congestion algorithm, retransmits, out-of-order and packet counts; the reverse lookup that named the server; the rate over the last minute.
- TLS, Content, Packets: the handshake, the decoded content and the packets need the network extension; in this version these tabs say what is still visible (the name, protocol, sizes) and why the rest isn't.
- Timeline: when the process started, when the name was found, when the connection was first seen, any rule that matches it (marked as not enforced yet) and when it closed.
Note: WHOIS in the To whom tab points to Tools › Lookup, which runs it. Sockets that were open before Network started are dated by their process.
Processes
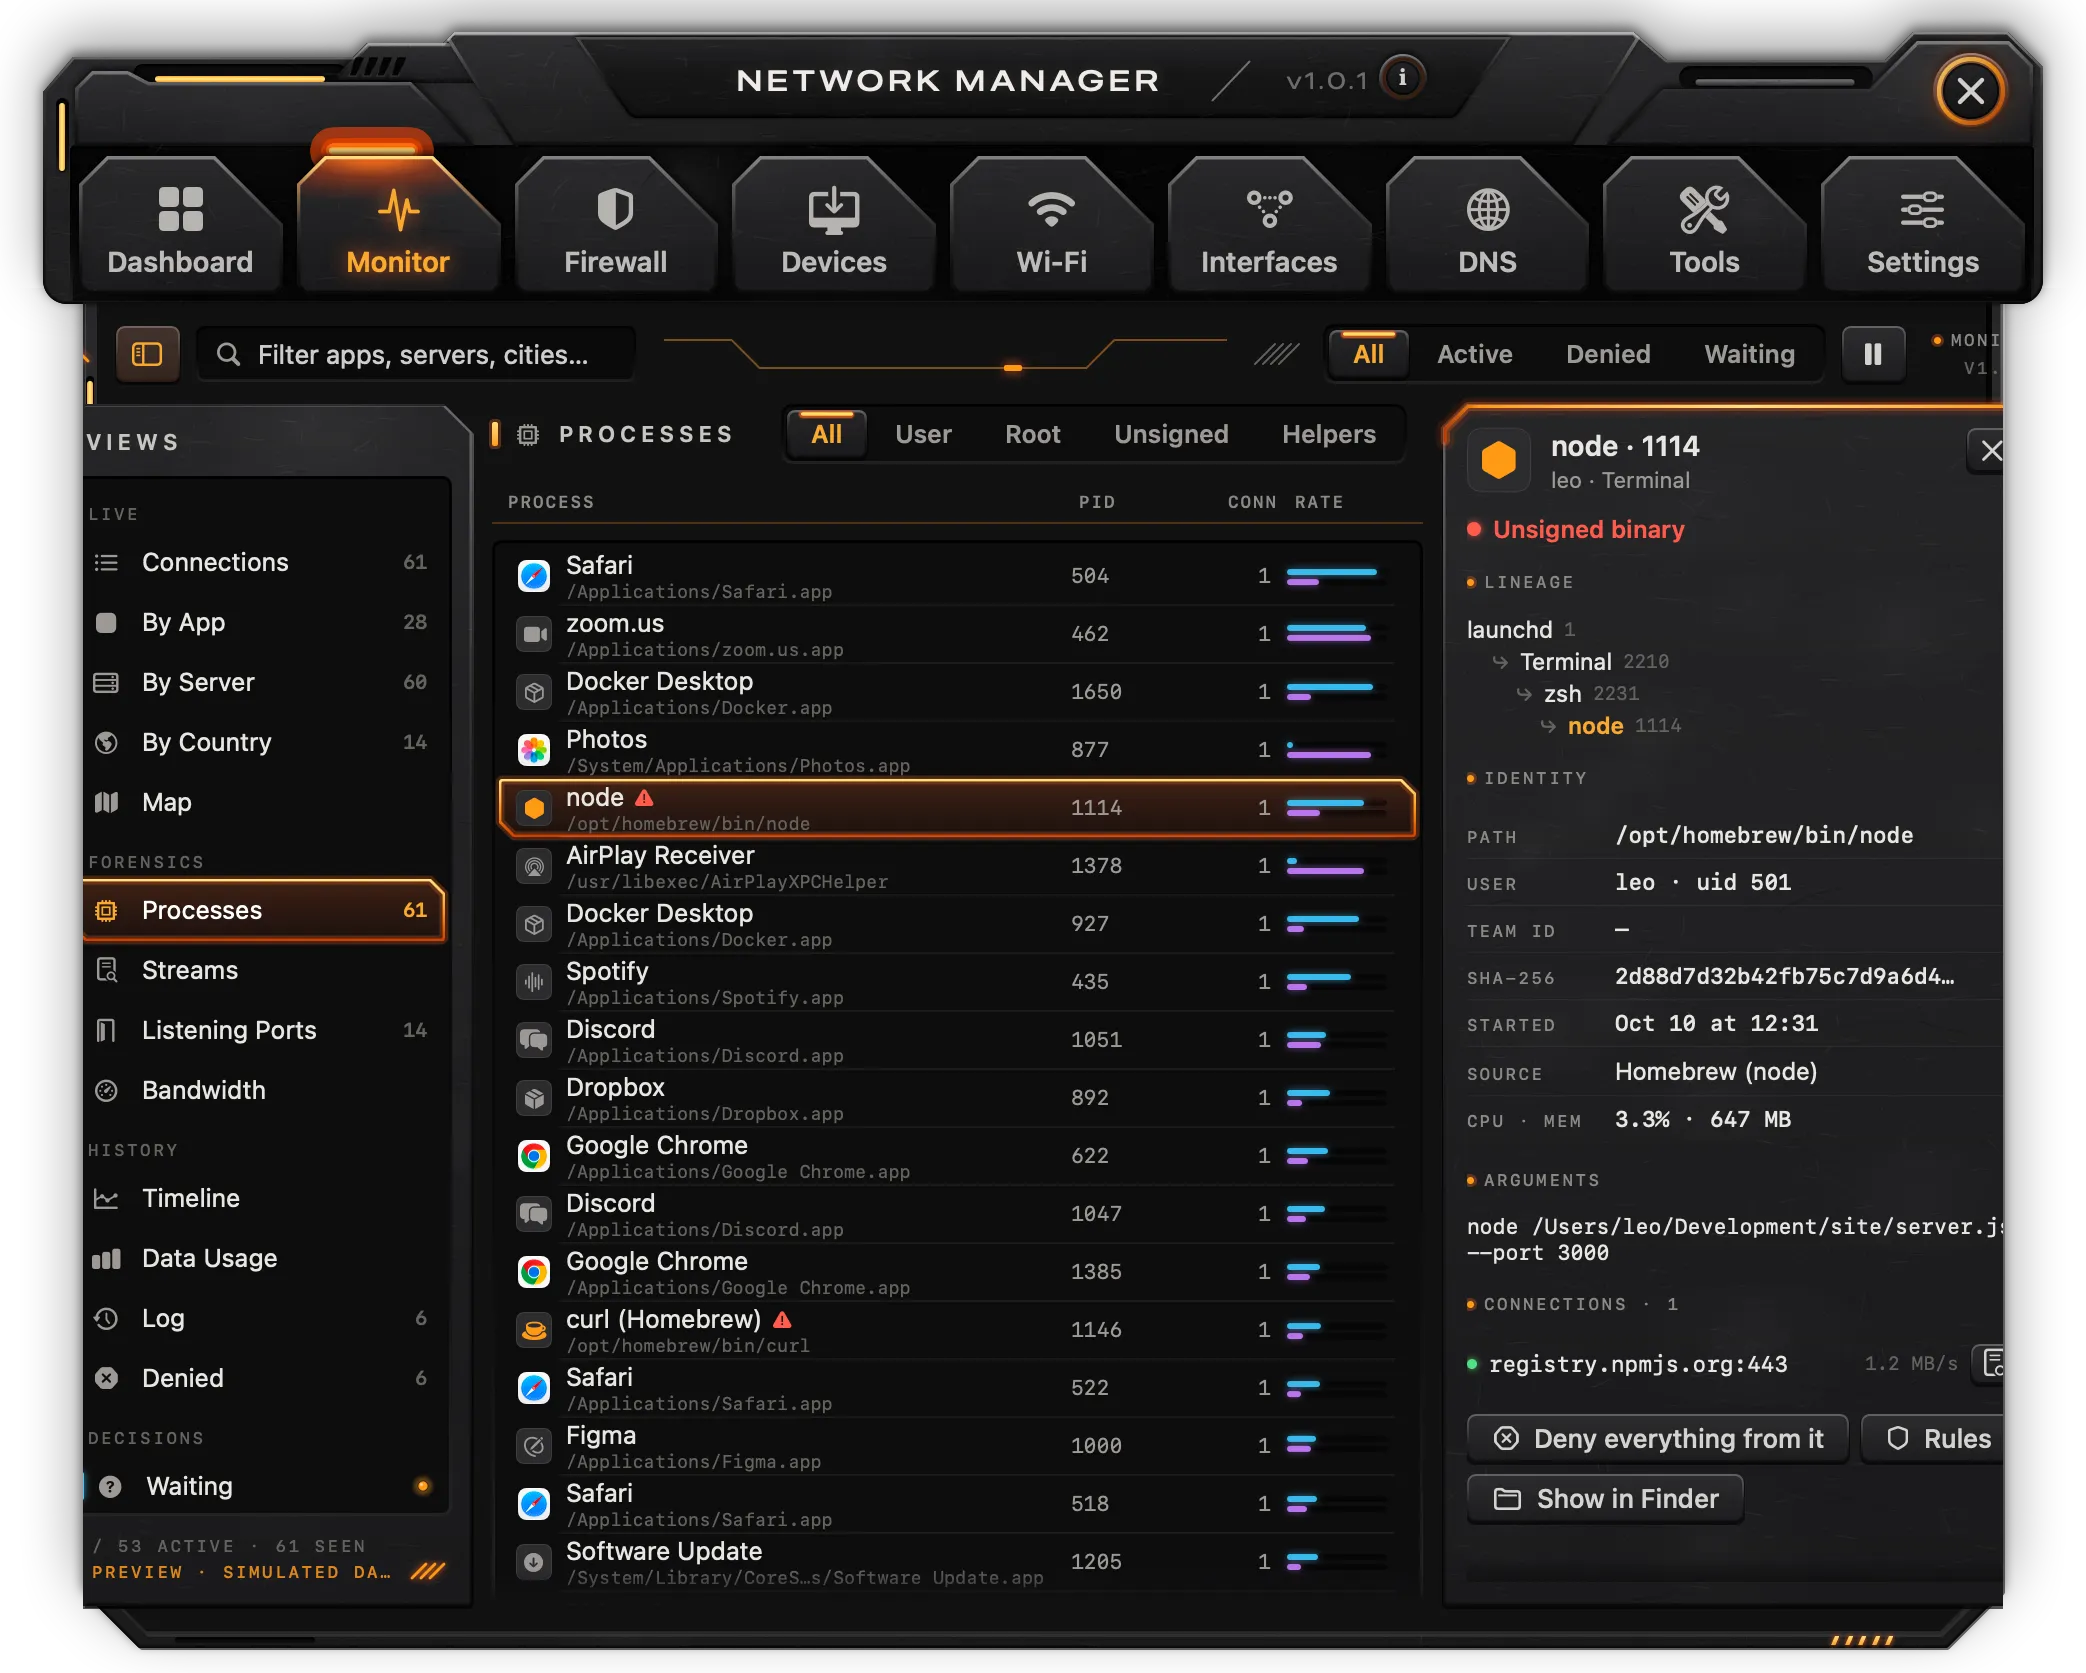
Every process with a socket: Process and path, PID, User (root is marked), Launched by, Signature (Apple or Dev ID, or Unsigned), connections, rate and total. Filter with All, User, Root, Unsigned or Helpers; the caption counts the unsigned ones.
The inspector shows who signed it, its lineage from launchd, its identity (path, user, Team ID, SHA-256, start, source, CPU and memory), the arguments it runs with, and each connection with a button to its dossier. Actions: Deny everything from it (rules, not enforced), Rules and Show in Finder.
Streams
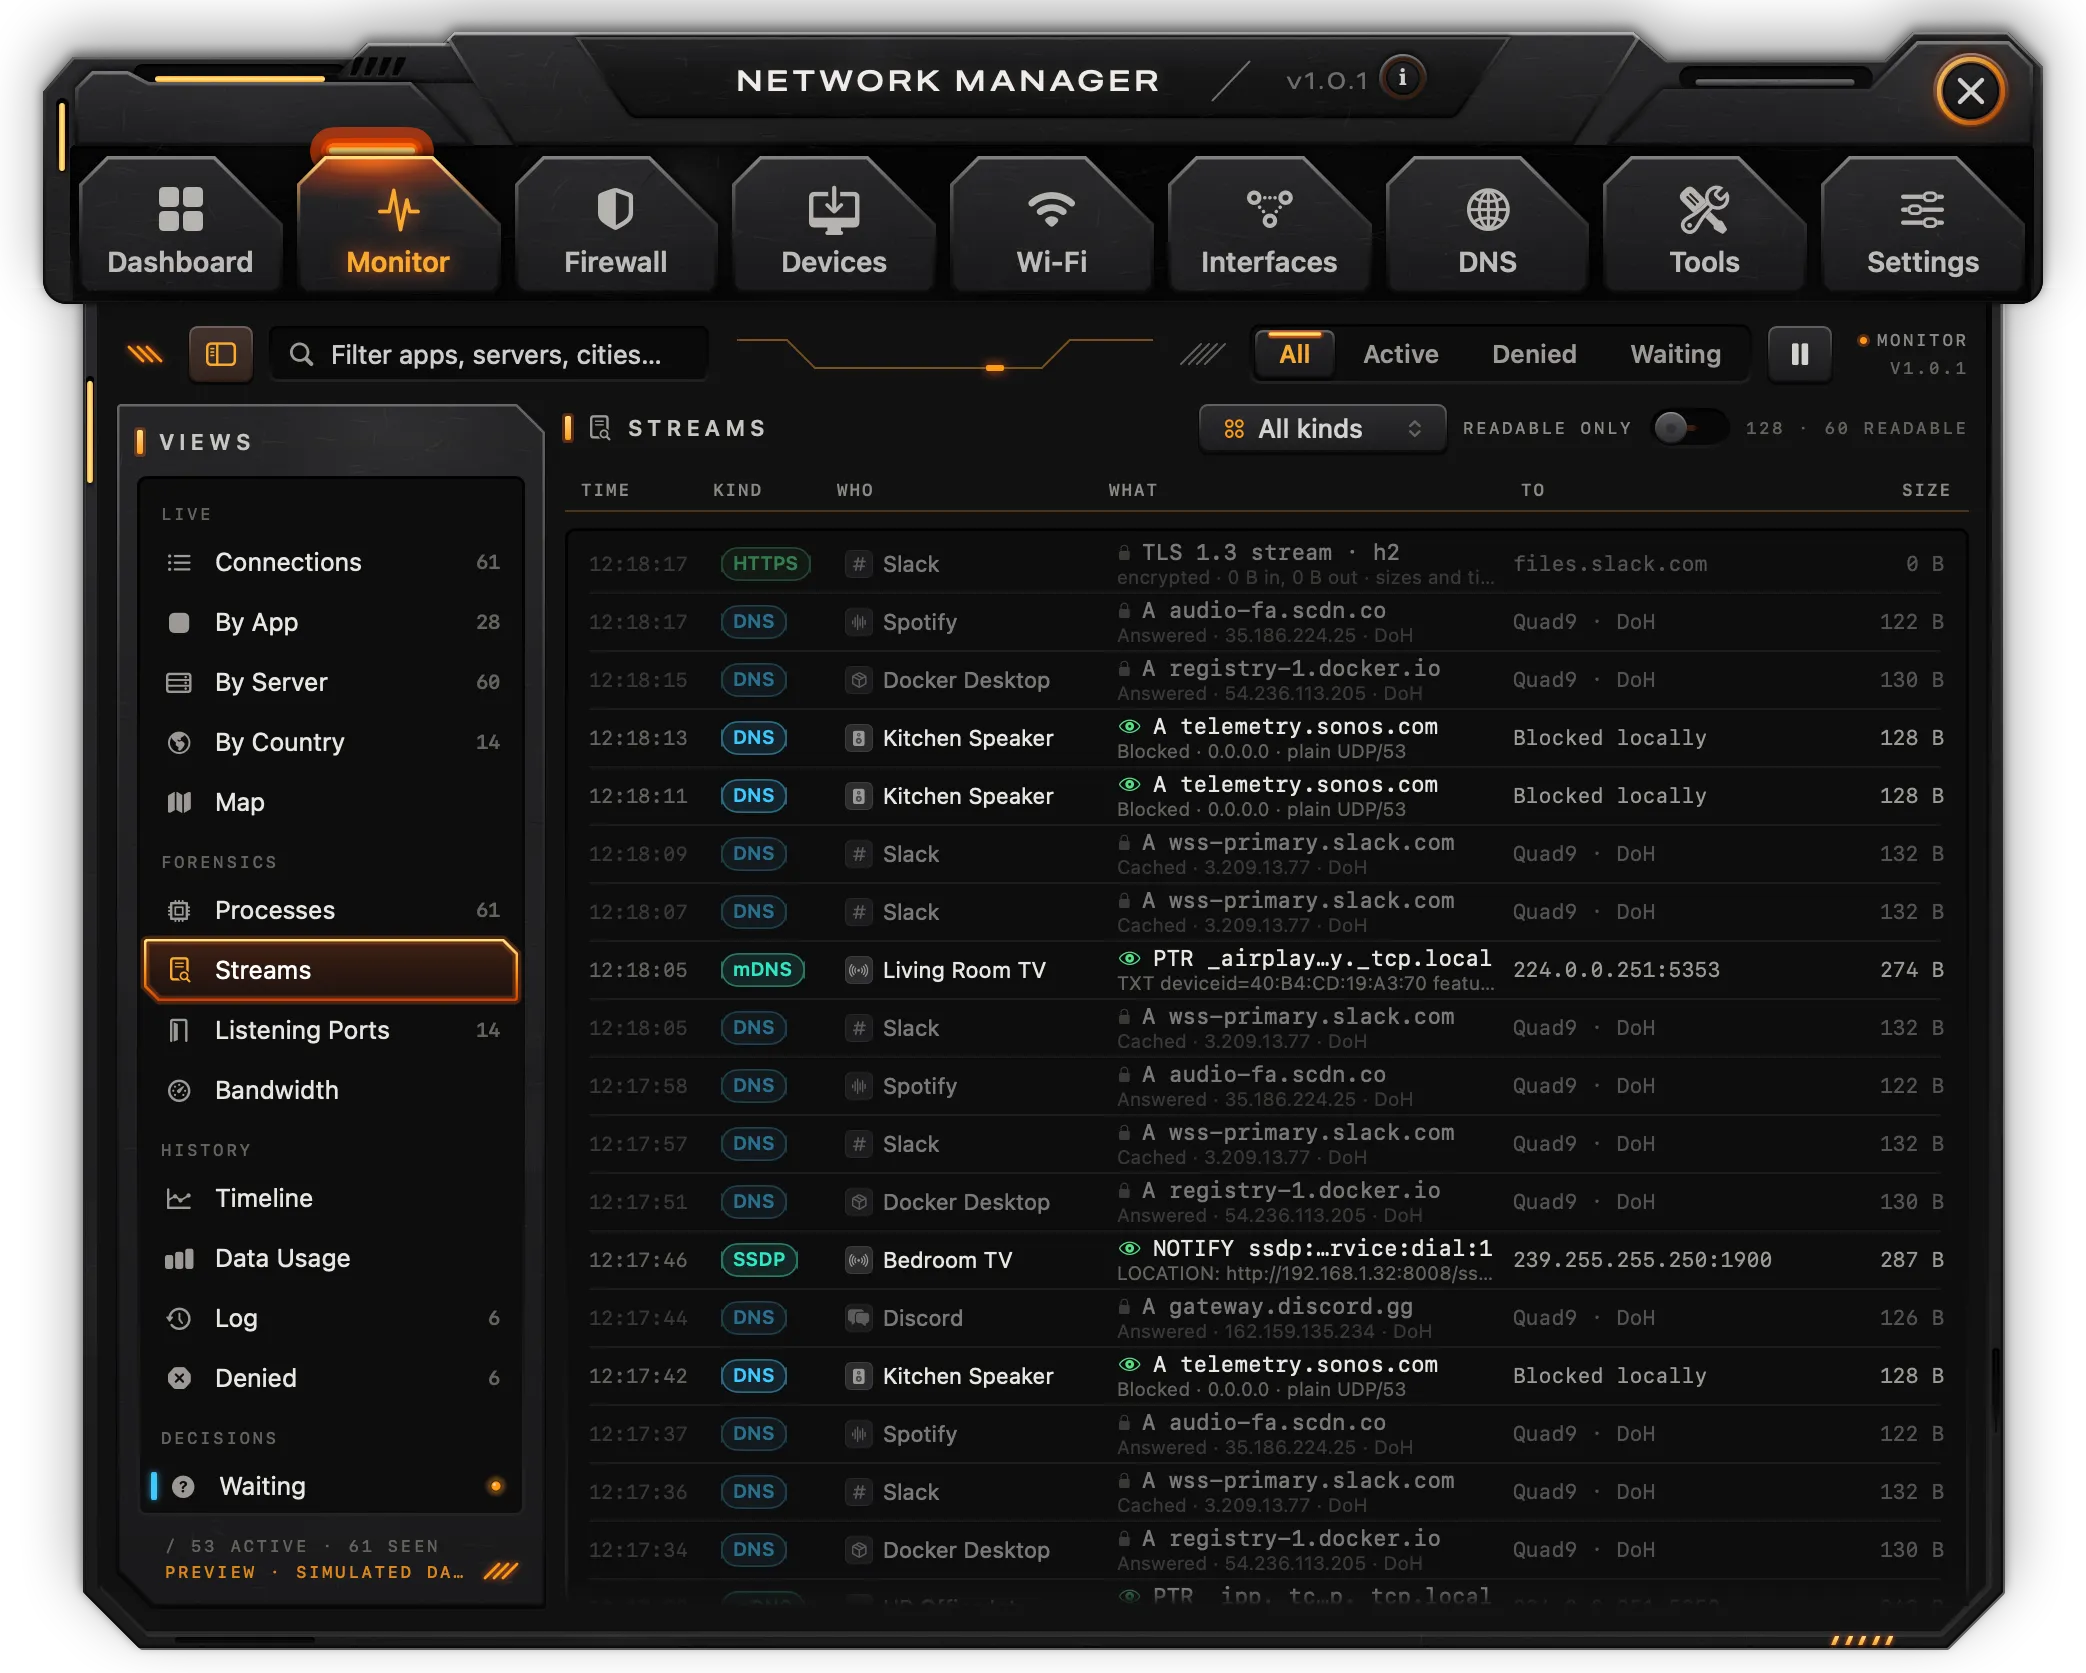
One record per live connection, by kind: HTTPS, QUIC, HTTP, DNS, mDNS, SSDP or Other, judged by protocol and port. Each shows the time, the app, a summary, the destination and the size. Pick a kind with All kinds; Readable only keeps the records whose content can be read, which in this version is none. The inspector shows when, from, to, size and what is visible, with Open the dossier.
Note: Reading the content of streams (HTTP transactions, DNS exchanges, broadcasts) needs the network extension. Today each record carries only sizes and timing.
Listening Ports
Every port a process on this Mac listens on: Port, Proto, Process with its PID, Service, Bound to, Exposure and Since. Exposure is This Mac only (loopback), Local network (one address) or Any network (every address); the caption counts the last kind. The inspector explains the exposure, shows the process and path, and offers Scan from outside (a port scan of the public address in Tools) and Firewall rules.
Bandwidth and Timeline
Bandwidth shows each app's rate this second as a bar, with a short graph. Clicking an app opens it in By App.
Timeline shows throughput (download above, upload below), latency to the router with a line at 50 ms, packet loss to 1.1.1.1, and readouts for average rates, latency spikes and jitter. Only the 5 min range is measured; the 1 hour, 24 hours and 7 days ranges are not recorded in this version and show a placeholder curve.
Data Usage
Bytes by app for the connections seen, and the total of today in each direction. The Today span reflects what was measured.
Note: The 7 days and Month spans, the per-day bars, the per-interface rows, the metered figure and Export CSV are not working in this version.
Log, Denied and Waiting
- Log: connections that ended. A closed connection stays in the list for about a minute.
- Denied: connections you marked with Deny. They are not blocked in this version.
- Waiting: connections held until you answer. Nothing waits in this version, because holding a connection needs the network extension. Show a Test Alert shows a sample of the alert; Snooze 15 min marks alerts as snoozed.
Firewall
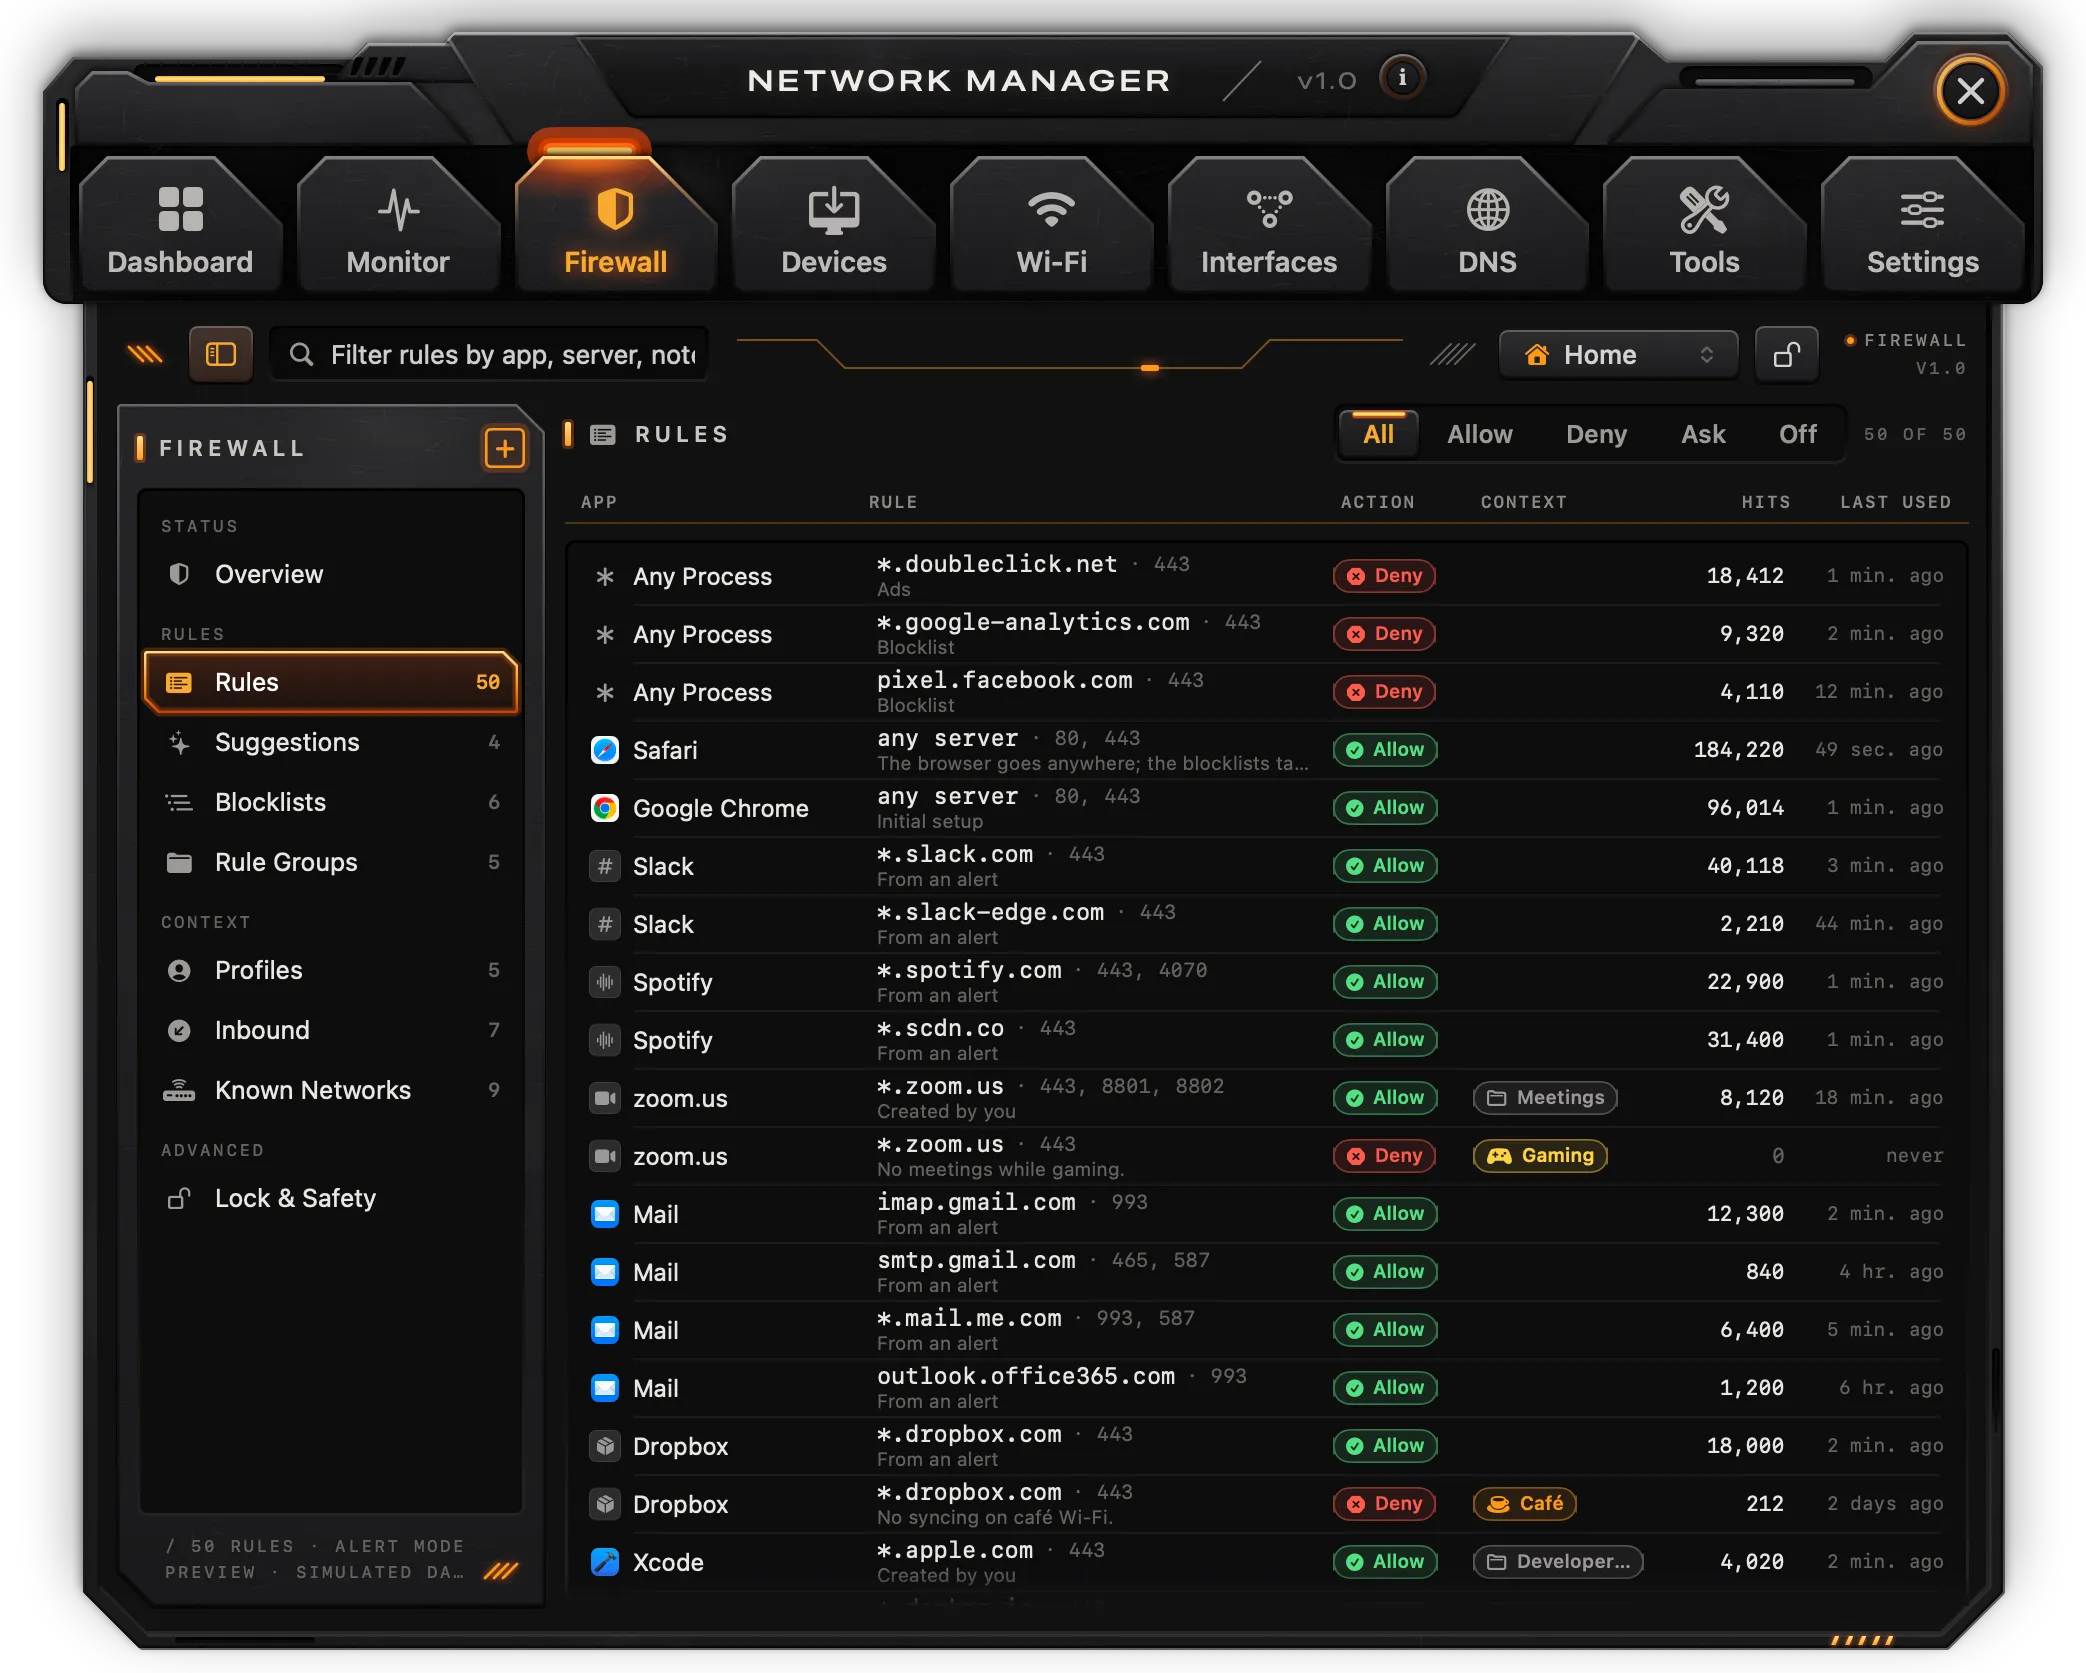
Note: The firewall doesn't filter in this version. Rules, profiles, blocklists and the alert are shown and can be edited, but nothing is enforced, and they are not kept after the app quits. When the app reads this Mac it starts with no rules; the profiles, known networks, blocklists and rule groups listed are examples.
The sidebar has Status (Overview), Rules (Rules, Suggestions, Blocklists, Rule Groups), Context (Profiles, Inbound, Known Networks) and Advanced (Lock & Safety). The + button above the sidebar creates a rule (New rule). The toolbar has the profile picker and the lock button.
Mode
Overview shows four mode tiles:
- Alert: connections without a rule wait for your answer.
- Silent Allow: connections without a rule go through, and are logged.
- Silent Deny: connections without a rule are refused, and logged.
- Off: nothing is filtered; the monitor keeps watching.
When the app reads this Mac the mode starts at Off. Below: tiles for rules, waiting connections, denied today and blocklist hits; Shields with Inbound firewall, Stealth mode, Kill switch and Block LAN on untrusted networks; the active profile; and recent firewall decisions.
Rules
Each rule reads as a sentence: App, Rule (the destination and ports, with its note or origin), Action, Context (profile, group or duration), Hits and Last used. Filter with All, Allow, Deny, Ask or Off (disabled rules). Rules come from New rule, from Allow and Deny in the Monitor and the dossier, and from answers to the alert.
Clicking a rule opens its editor:
- Allow, Deny or Ask, and Enabled;
- Direction: Outgoing, Incoming or Both;
- Destination: Any server, Domain, Host, IP address, IP range, Local network or Country, with the value (for example
*.example.com,10.0.0.0/8or a country code); - Ports and Protocol (Any, TCP, UDP, QUIC, ICMP);
- Lasts: Forever, Until quit, Until logout, Until restart or 30 minutes (30-minute rules from the alert are removed when they run out);
- Context: a profile (All profiles) and a group (No group), and Priority (wins over every other rule and the blocklists);
- Note, and a Record of hits, last use, creation, origin and the app's path.
Save keeps the changes, Revert drops them, Delete… asks before removing the rule. Connections opens the app's connections; Duplicate copies the rule. Rules from a remote group are read only.
Suggestions
Rules that aren't pulling their weight, in four groups: Unused for 90 days, Redundant (a broader rule for the same app decides the same way), Temporary (made from an alert for a while) and Orphaned. Each rule has Edit and Delete; temporary ones also Keep forever. Apply All Safe deletes the redundant and orphaned ones.
Blocklists and Rule Groups
Blocklists lists domain lists with a switch, their category, source address, entries and hits. Add a list takes a URL in hosts, domains or Adblock format.
Rule Groups lists groups of rules switched on and off together, local and remote. New Group adds one.
Note: In this version blocklists and remote groups are not downloaded, and switching them changes nothing on the network. When the app reads this Mac they start switched off.
Profiles and Known Networks
Profiles shows each profile with the networks it is meant for, its DNS, tunnel, whether the LAN is blocked and its rule count. Activate makes one active (also from the toolbar and the menu bar panel); New Profile adds one.
Known Networks lists networks with a trust level (Trusted, Untrusted, Public), a profile, and switches for LAN, Bonjour and AirDrop.
Note: Profiles don't switch by themselves and don't change DNS or tunnels in this version; the known networks listed are examples.
Inbound
Who may connect to this Mac: the Firewall and Stealth switches, readouts for listening ports and how many are exposed to the internet, and a rule per listening app (Allow, Deny or Ask). These are not enforced in this version, and the rows under Everything else are fixed.
Lock & Safety
- Lock the configuration: while on, the mode, the profile and the rules can't be changed in the app. In this version locking and unlocking don't ask for Touch ID.
- Kill switch: Stop Everything… asks for confirmation; Turn Off ends it. Not enforced in this version.
- Reset…: removes the rules after you type
DELETEto confirm. - Show Alert: shows the connection alert for a made-up connection.
Unlock until quit, Updates need Touch ID, Export…, Import… and Show Backups have no effect in this version.
The connection alert
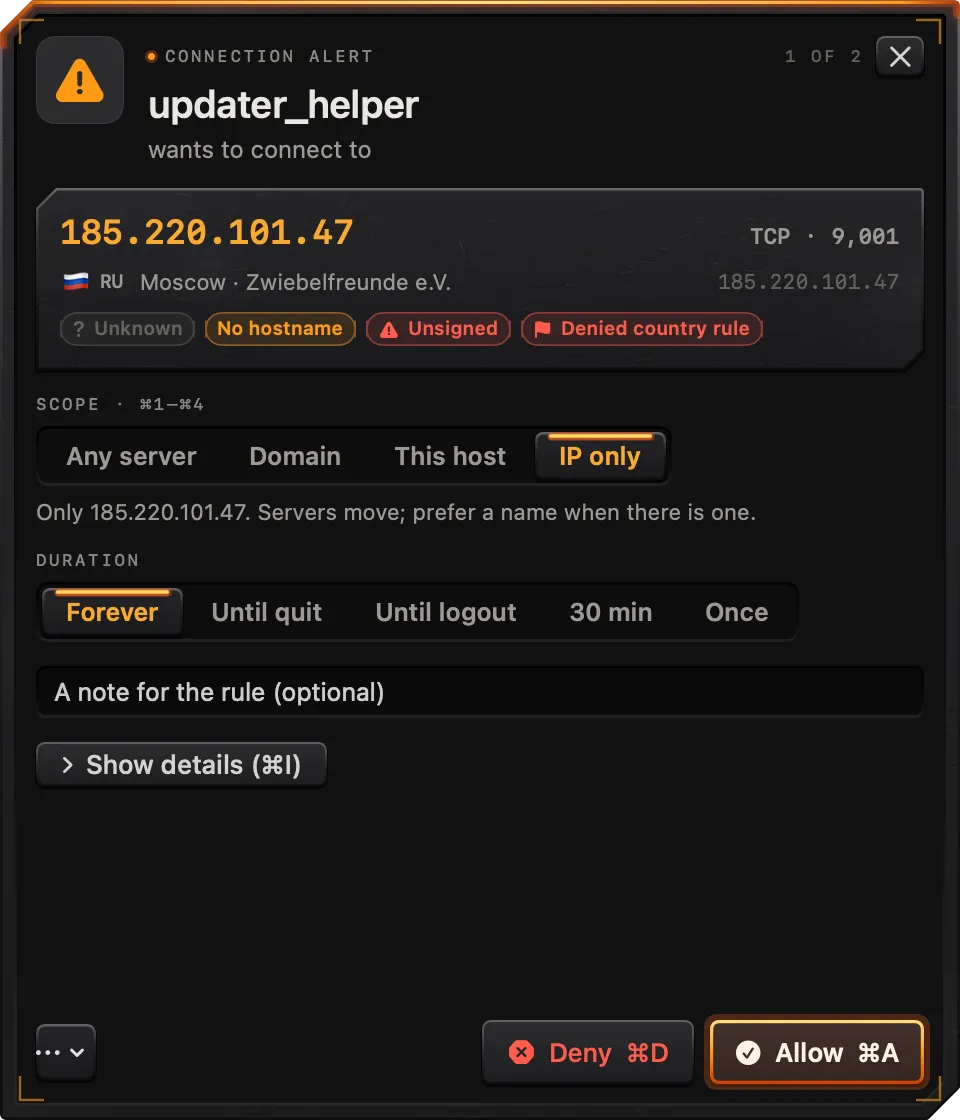
The alert is a floating panel that asks about a connection without a rule. In this version it appears only as a sample, from Test Alert on the Dashboard, Show a Test Alert in Monitor › Waiting or Show Alert in Lock & Safety. Where it opens is set in Settings › Connection alerts open at.
It shows the app, what it wants to reach (name, protocol and port, place, network and address), chips for the category, how the name was found, an unsigned binary or a listed tracker, and the position in the queue ("1 of 3"). Then:
- Scope: Any server, the domain (for example
*.example.com), This host or IP only, with a sentence saying what it covers; - Duration: Forever, Until quit, Until logout, 30 min or Once;
- a note for the rule;
- Show details: process and PID, path, developer, signature, parent, local interface and port, network, and the number of rules for the app;
- Apply to all from this app, when several connections from the same app wait;
- Deny and Allow, and a menu with Snooze alerts 15 minutes, Snooze alerts 1 hour, Open the Monitor and Look up the server.
Answering creates a rule (not enforced) and moves to the next connection waiting.
| Shortcut | Action |
|---|---|
⌘A | Allow |
⌘D | Deny |
⌘1 | Scope: Any server |
⌘2 | Scope: the domain |
⌘3 | Scope: This host |
⌘4 | Scope: IP only |
⌘I | Show or hide details |
Esc | Close the alert and decide later |
Devices
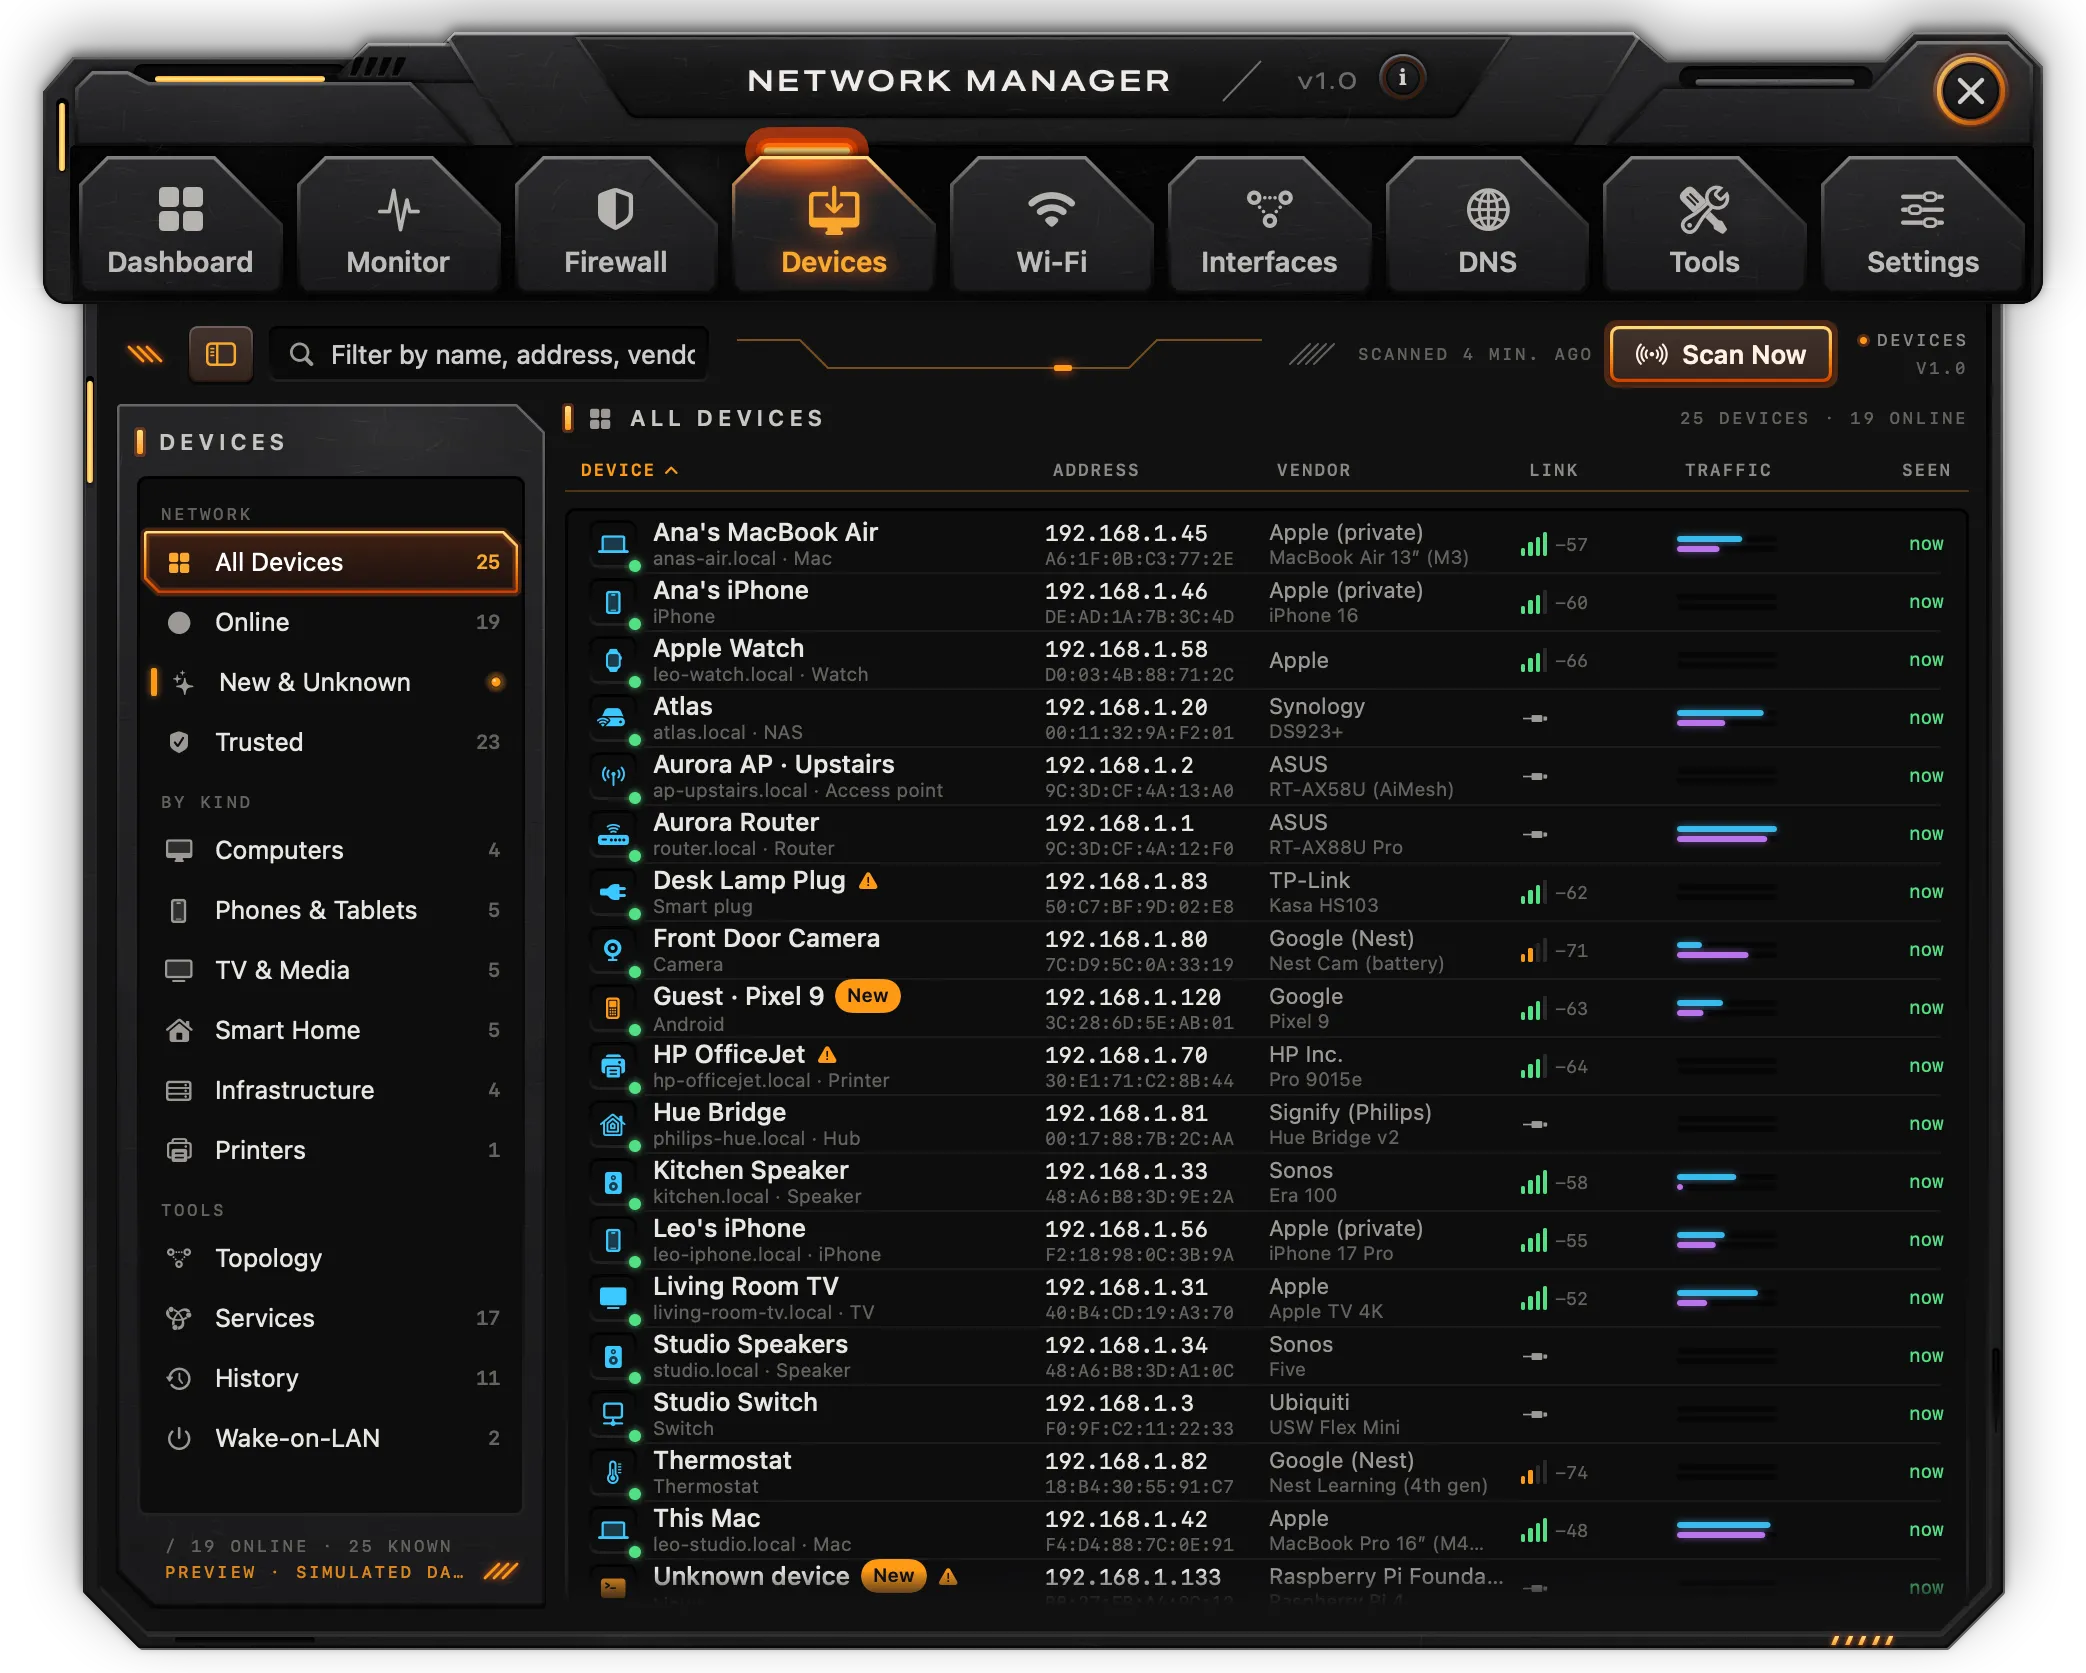
Devices lists what is on the local network. The sidebar has Network (All Devices, Online, New & Unknown, Trusted), By kind (Computers, Phones & Tablets, TV & Media, Smart Home, Infrastructure, Printers) and Tools (Topology, Services, History, Wake-on-LAN). The filter field searches names, addresses, MAC addresses and vendors.
Scanning
Scan Now pings every address of the Mac's /24 network, reads the ARP table again and browses Bonjour for a few seconds. The first time, macOS asks for Local Network access; until it is granted the list stays empty. Between scans, the list follows the ARP table every five seconds: devices that appear are added and marked New, and devices not seen for two minutes go offline. The caption shows when the last scan ran.
Device list
Columns: Device (name, hostname and kind), Address (IP and MAC), Vendor, Link, Traffic and Seen. Click a header to sort. Names come from reverse DNS and Bonjour; the vendor from a short built-in table of makers; the kind is a guess from the name, vendor and Bonjour services.
Device inspector
The inspector shows whether the device is online, and its identity: IPv4, MAC, hostname, vendor, model, system, link, first and last seen, and its Bonjour services.
- Rename and Trust: kept until the app quits.
- Ping and Port scan: open the tool in Tools with the device's address.
- Block internet, Wake and Notify when online: not working in this version. To wake a machine, use the Wake-on-LAN page or Tools › Wake-on-LAN.
Note: Traffic per device and blocking a device need the network extension.
Topology, Services and History
Topology draws the internet, the router and, under it, a branch per interface with the devices on it. Clicking a device or the router opens it.
Services groups the Bonjour services found by type (AirPlay, printers, file sharing, HomeKit and others), with the devices that offer each.
History lists device events such as trusting a device.
Wake-on-LAN
Lists the devices marked for Wake-on-LAN. Under Any other machine, type a MAC address and click Send Magic Packet to broadcast a real magic packet on the local network. The machine has to be on the same network, plugged in, and allow Wake-on-LAN in its own settings.
Wi-Fi
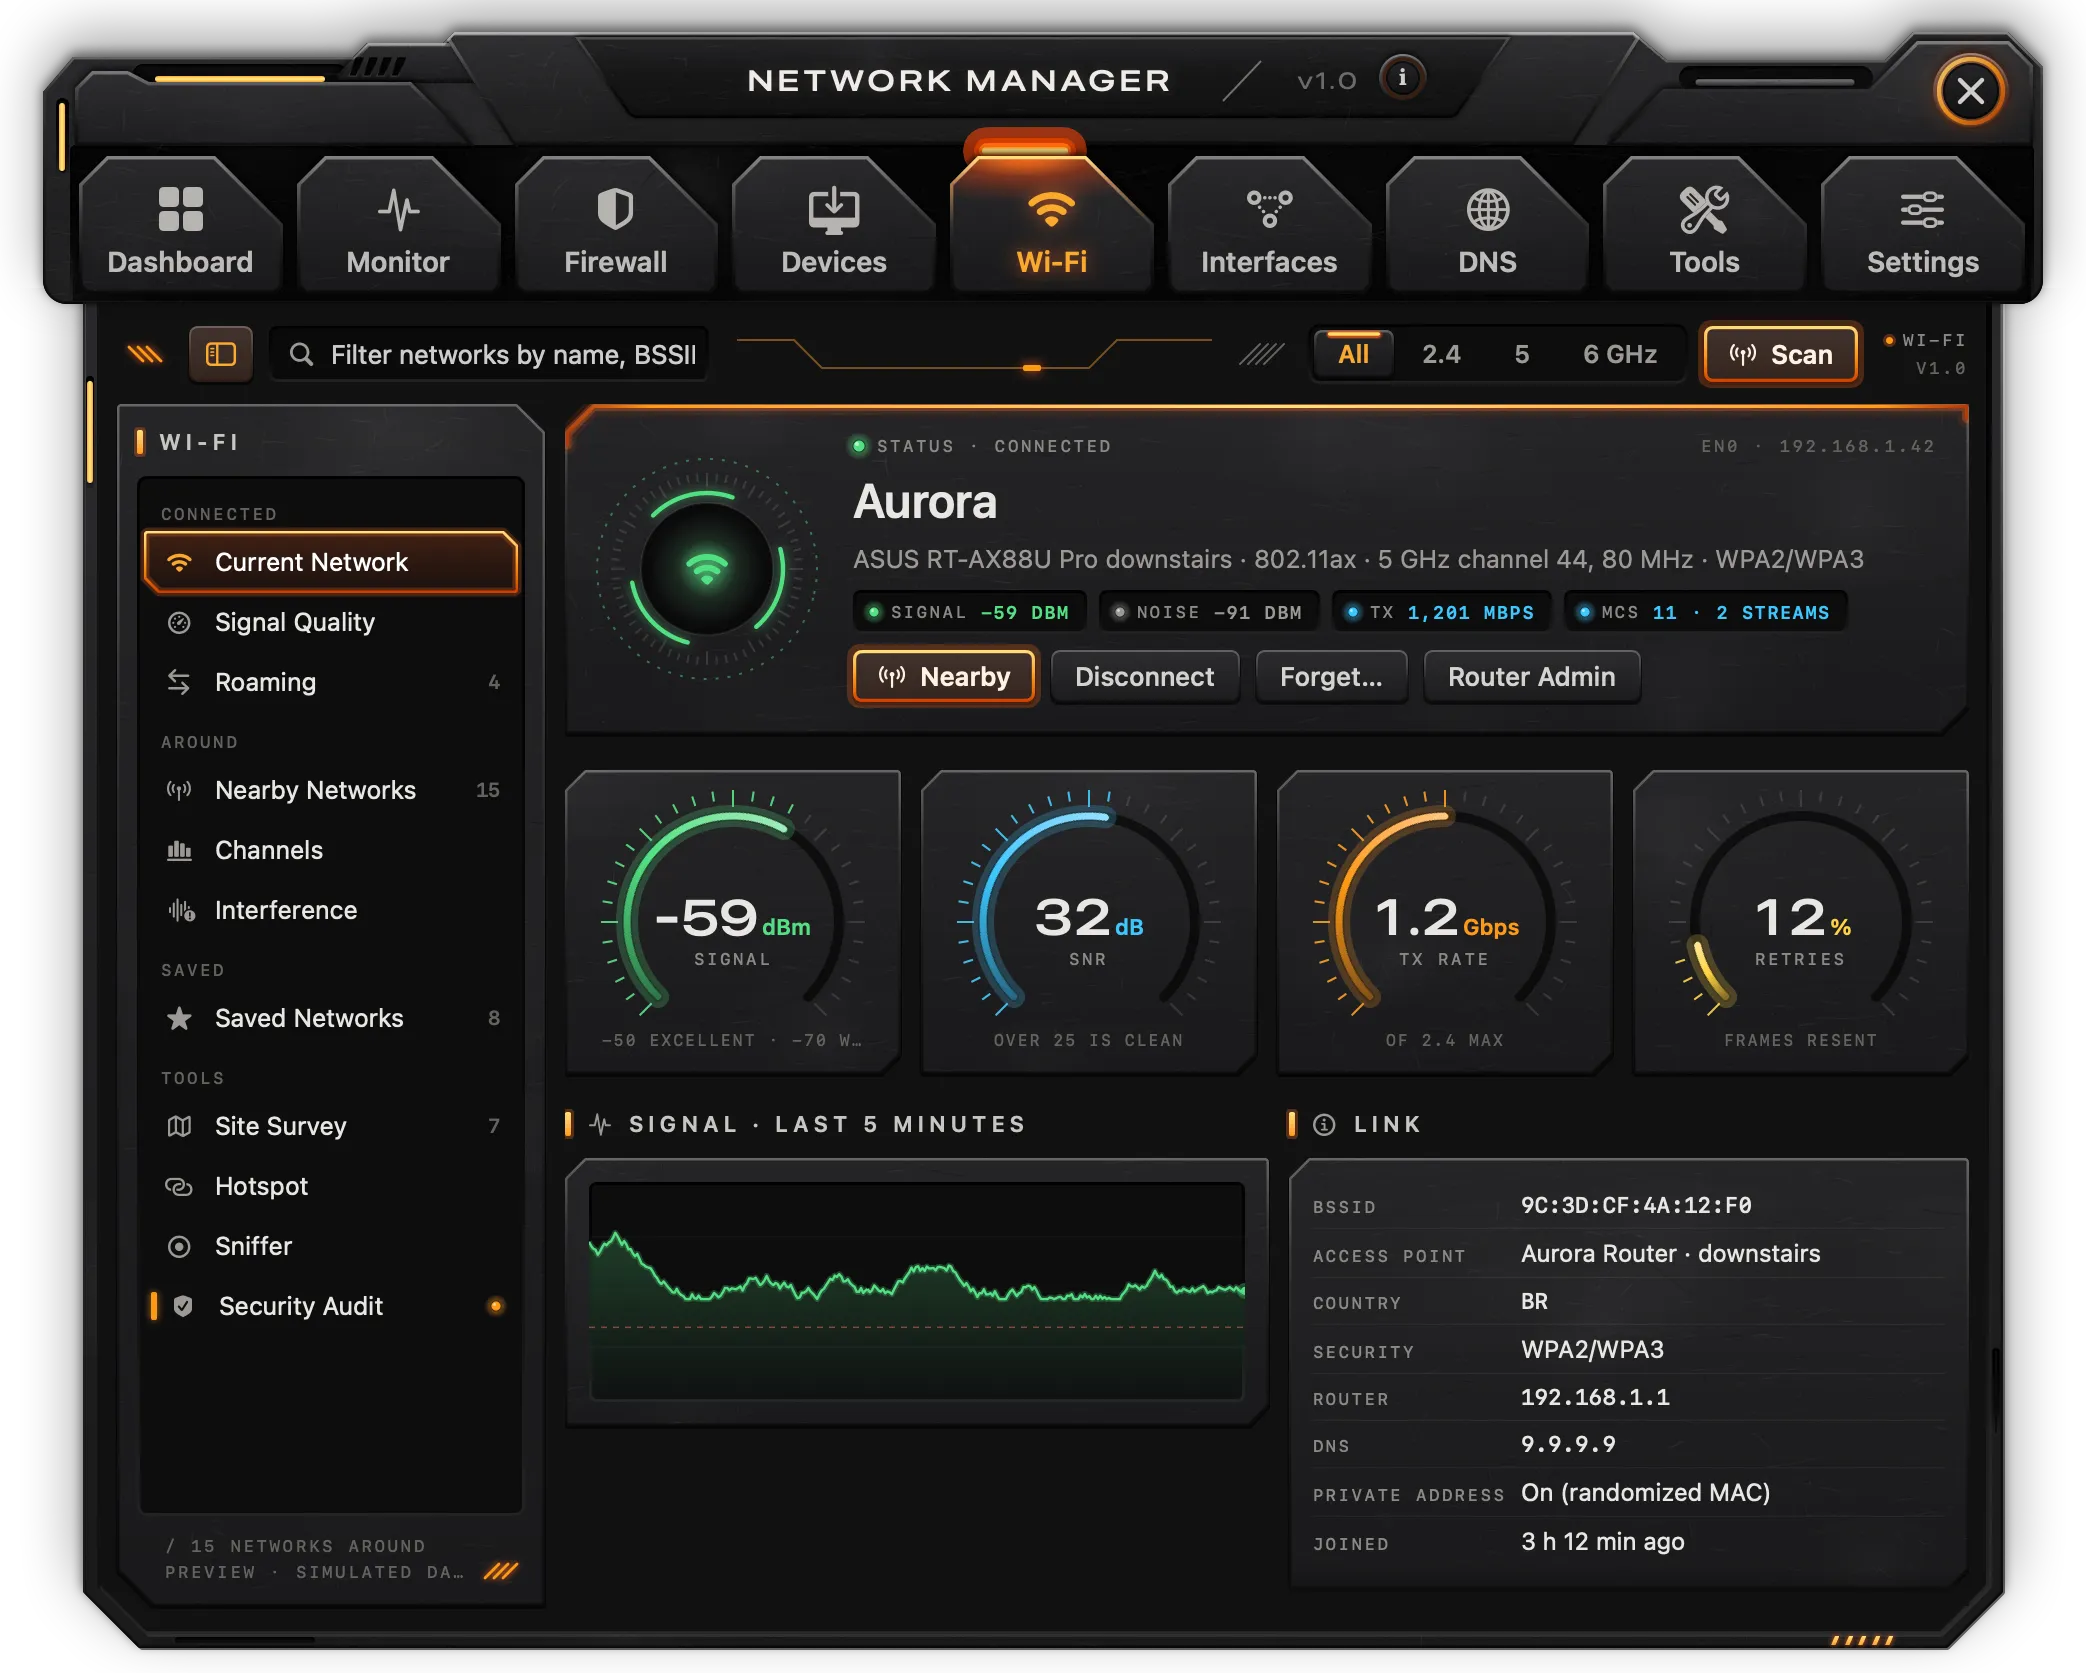
Wi-Fi reads the Mac's radio. The sidebar has Connected (Current Network, Signal Quality, Roaming), Around (Nearby Networks, Channels, Interference), Saved (Saved Networks) and Tools (Site Survey, Hotspot, Sniffer, Security Audit). The toolbar has a band filter (All, 2.4, 5, 6 GHz) and Scan.
Network names and access point addresses need Location permission (Settings › Permissions).
Current Network
The network you're on, with the access point's vendor, PHY mode, band, channel, width and security; readouts for Signal, Noise and Tx; dials for Signal, SNR, Tx rate and Retries (retries need the network extension); the signal over the last 5 minutes; and Link facts: BSSID, access point, country, security, router, DNS and whether the Mac uses a private address on this network. Router Admin opens the router's address in the browser; Nearby opens Nearby Networks. Disconnect and Forget… have no effect in this version.
Signal Quality and Roaming
Signal Quality scores the link from six factors. In this version only Signal and Latency are measured; Noise floor, Channel load, Retries and Roaming are fixed, so the score is an approximation.
Roaming lists the access points broadcasting your network's name, from the last scan. Roams between them are not recorded in this version.
Nearby Networks
Scan lists the networks around: name (or "Hidden network"), BSSID, band and channel, width, signal, security, vendor and PHY mode. The caption counts the open or weak ones. A network with your network's name from an unknown vendor is flagged Evil twin?. The inspector shows signal, noise, SNR and quality, the facts, and Copy BSSID. Join, Save and Mark as rogue have no effect in this version.
Channels and Interference
Channels shows, per band, how busy each channel is from the last scan: the bar is an estimate of air time, the number is the networks on it, and your channel is lit. Open router to change opens the router's page.
Interference counts the networks on your channel (Co-channel) and on overlapping ones (Adjacent), and lists them.
Note: The Quietest channel readouts on Channels, and Air time free, Non-Wi-Fi and Other sources on Interference, are fixed text in this version.
Saved Networks
The Wi-Fi networks this Mac joins by itself, in its order, read from macOS. The switches for Auto-join and Private, the arrows, Forget and the key button change only what the app shows; macOS's list is not modified in this version. The security shown for each saved network is not read from the system.
Security Audit
Checks drawn from the radio and the last scan: the security of your network, a second network with your name that doesn't match yours, open or WEP networks nearby, networks without a name, how many networks share your channel, and whether this Mac uses a private address. Run Again scans and checks again. WPS, guest isolation and remote administration live in the router and can't be read from the air; detecting deauthentication frames needs monitor mode, which comes with the Sniffer in a later version.
Site Survey, Hotspot and Sniffer
These pages are previews in this version:
- Site Survey records a point per room with Record Here, but the values recorded are not a measurement.
- Hotspot (Internet Sharing and Personal Hotspot) changes nothing on the Mac.
- Sniffer (monitor mode on a channel) comes in a later version.
Interfaces
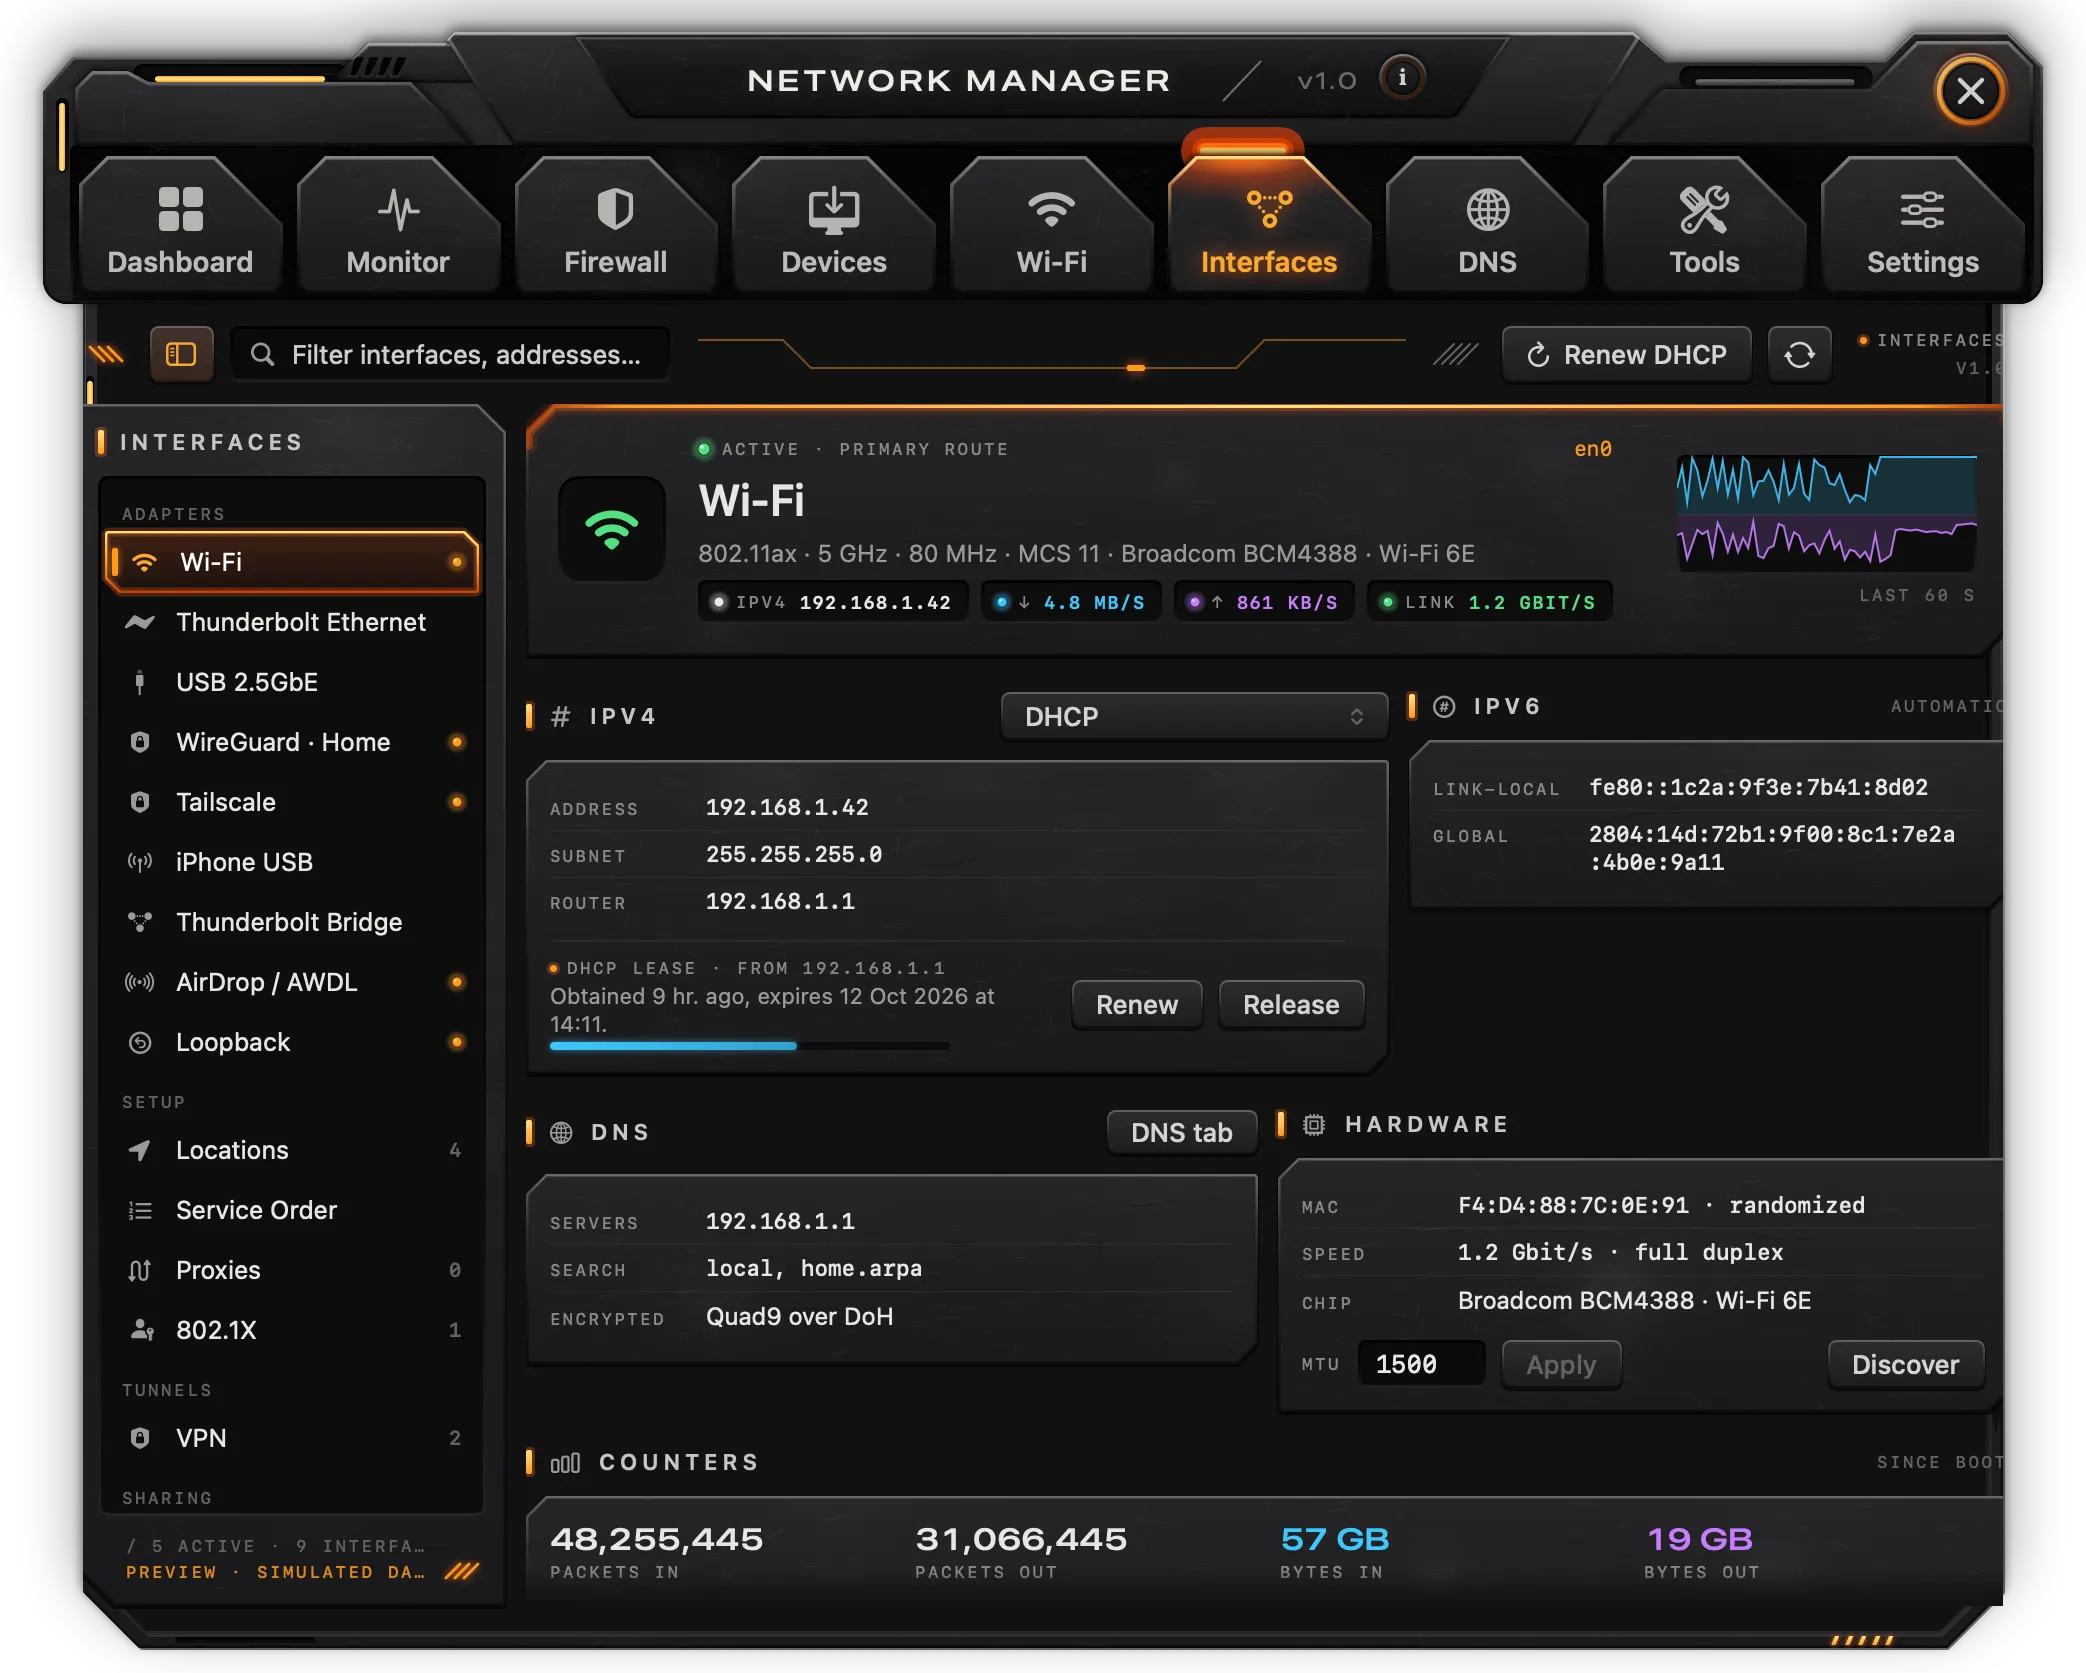
The sidebar lists every adapter under Adapters (Wi-Fi, Ethernet, Thunderbolt, USB, bridges, tunnels and loopback), the primary one highlighted and a lamp on active ones; then Setup (Locations, Service Order, Proxies, 802.1X), Tunnels (VPN) and Sharing (Sharing & Bridges, Private Relay). The filter field filters adapters by name or address. Renew DHCP in the toolbar renews the lease on en0.
Adapters
Each adapter's page shows:
- the state (active, primary route), name, media and chip, IPv4 address, current rates, link speed and a graph of the last 60 seconds;
- IPv4: address, subnet and router, and the DHCP lease (server, obtained, expiry) with Renew;
- IPv6: its addresses;
- DNS: the servers and search domains for the interface, with a button to the DNS tab;
- Hardware: MAC, speed and duplex, chip, MTU, and Discover (Tools › MTU Discovery);
- Counters since boot: packets and bytes in and out, errors, drops and collisions.
Actions: Disable / Enable (asks for an administrator password), Diagnostics (pings the router in Tools), Connections on the interface, Copy address.
Note: Renew asks for an administrator password. Release, the IPv4 configuration picker and its Apply, the MTU Apply and Randomize MAC don't change the Mac in this version.
Locations
The network locations defined in macOS, with the active one marked. Switch changes to another location (asks for an administrator password). New Location, Edit and Duplicate don't change the Mac in this version.
Service Order
The network services in macOS's order, with the one carrying the default route marked, and the first eight routes of the routing table. Reordering with the arrows changes only the list shown.
Proxies and 802.1X
Proxies lists the system's web, secure web, SOCKS and FTP proxies and any automatic configuration script, read from macOS. The switches and the bypass settings don't change the Mac in this version.
802.1X is a preview and shows an example profile.
VPN
Every VPN configuration macOS knows (System Settings › VPN), with its type and status. Connect and Disconnect start and stop it. Leak Test asks Cloudflare which public address and network this Mac has right now (noting whether a tunnel is connected), checks whether IPv6 is reachable, and asks which resolver reaches the internet for this Mac; compare the result with the tunnel's exit.
Note: On demand, the per-tunnel Kill switch, split tunneling and Add… don't work in this version.
Sharing and Private Relay
Sharing & Bridges and Private Relay are previews: their switches and figures don't reflect or change the Mac in this version.
DNS
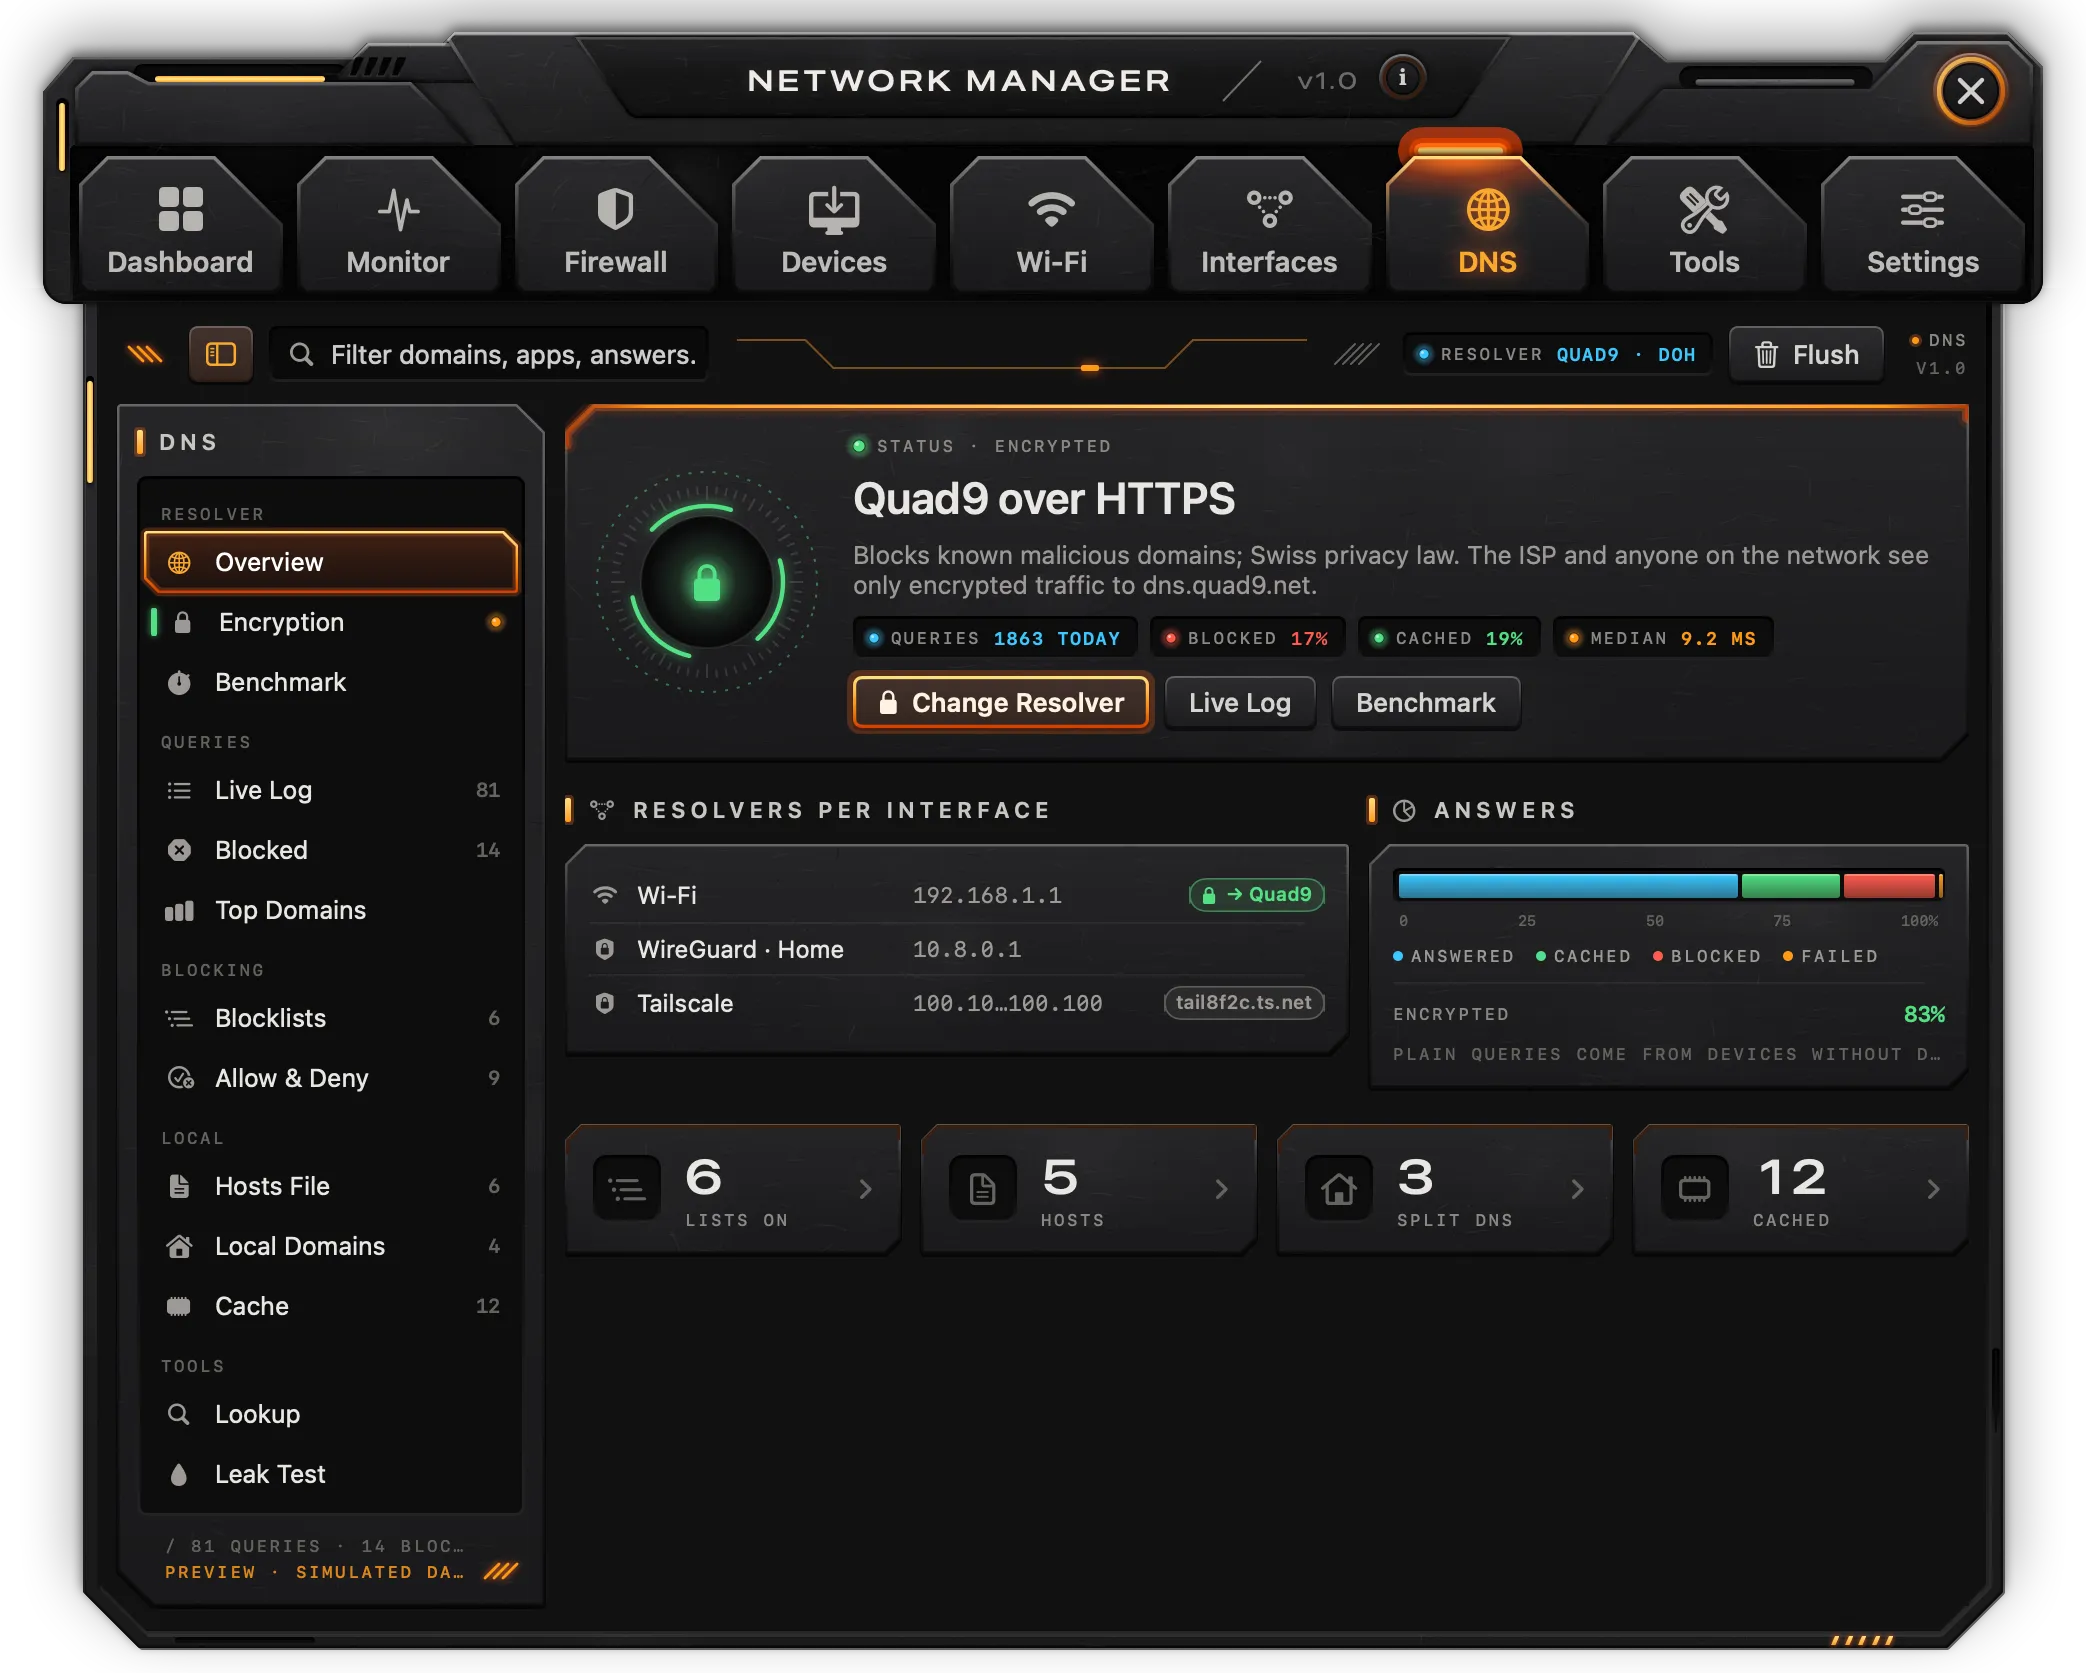
The sidebar has Resolver (Overview, Encryption, Benchmark), Queries (Live Log, Blocked, Top Domains), Blocking (Blocklists, Allow & Deny), Local (Hosts File, Local Domains, Cache) and Tools (Lookup, Leak Test). The toolbar shows the resolver in use and Flush.
Overview
The resolver macOS is using, named when it is a known public one (Quad9, Cloudflare, Google, AdGuard, Mullvad, NextDNS, DNS4EU, OpenDNS), otherwise "Router" or "System" with its address. When the app reads this Mac, DNS shows as plain (UDP port 53). Resolvers per interface lists the DNS servers of each active interface. Buttons: Change Resolver, Live Log, Benchmark.
Changing the resolver
Encryption shows a card per resolver. Clicking a public resolver sets it as the DNS servers of the primary network service, using its plain addresses; macOS asks for an administrator password. Clicking the system or router entry goes back to the servers handed out by DHCP.
Note: Encrypted DNS (DoH / DoT and the encrypt switch), Custom, Exceptions and the switches under Also don't change the Mac in this version. The latency shown on each card is not measured.
Benchmark
Run Benchmark is a preview in this version: the figures it shows are not measured from your network. To compare resolvers, ping their addresses in Tools or use Tools › Latency Board.
Queries
Live Log, Blocked and Top Domains need the DNS proxy that comes with the network extension. They stay empty when the app reads this Mac.
Blocklists and Allow & Deny
Blocklists shows the same lists as the firewall, applied at the resolver. Allow & Deny keeps an allowlist and a denylist of domains (wildcards allowed). Neither is applied in this version.
Hosts File and Local Domains
Hosts File shows the entries of /etc/hosts as a table: switch, host, address and note. Open /etc/hosts shows the file in Finder.
Note: Editing, adding or removing entries changes only the table;
/etc/hostsis not written in this version.
Local Domains (split DNS) lists domains sent to their own resolver. It is empty when the app reads this Mac and is not applied in this version.
Cache
Flush clears the system's DNS caches: the directory service cache right away, and mDNSResponder's after an administrator password. The list of cached names is not read from macOS and stays empty.
Lookup and Leak Test
Lookup is the Lookup tool (see Tools).
Leak Test shows the configured resolver, the resolver address that actually reaches the internet (from whoami.akamai.net), what Google's name servers see, and a verdict: lookups going to the router, a resolver on your ISP's network, or the resolver you chose.
Tools
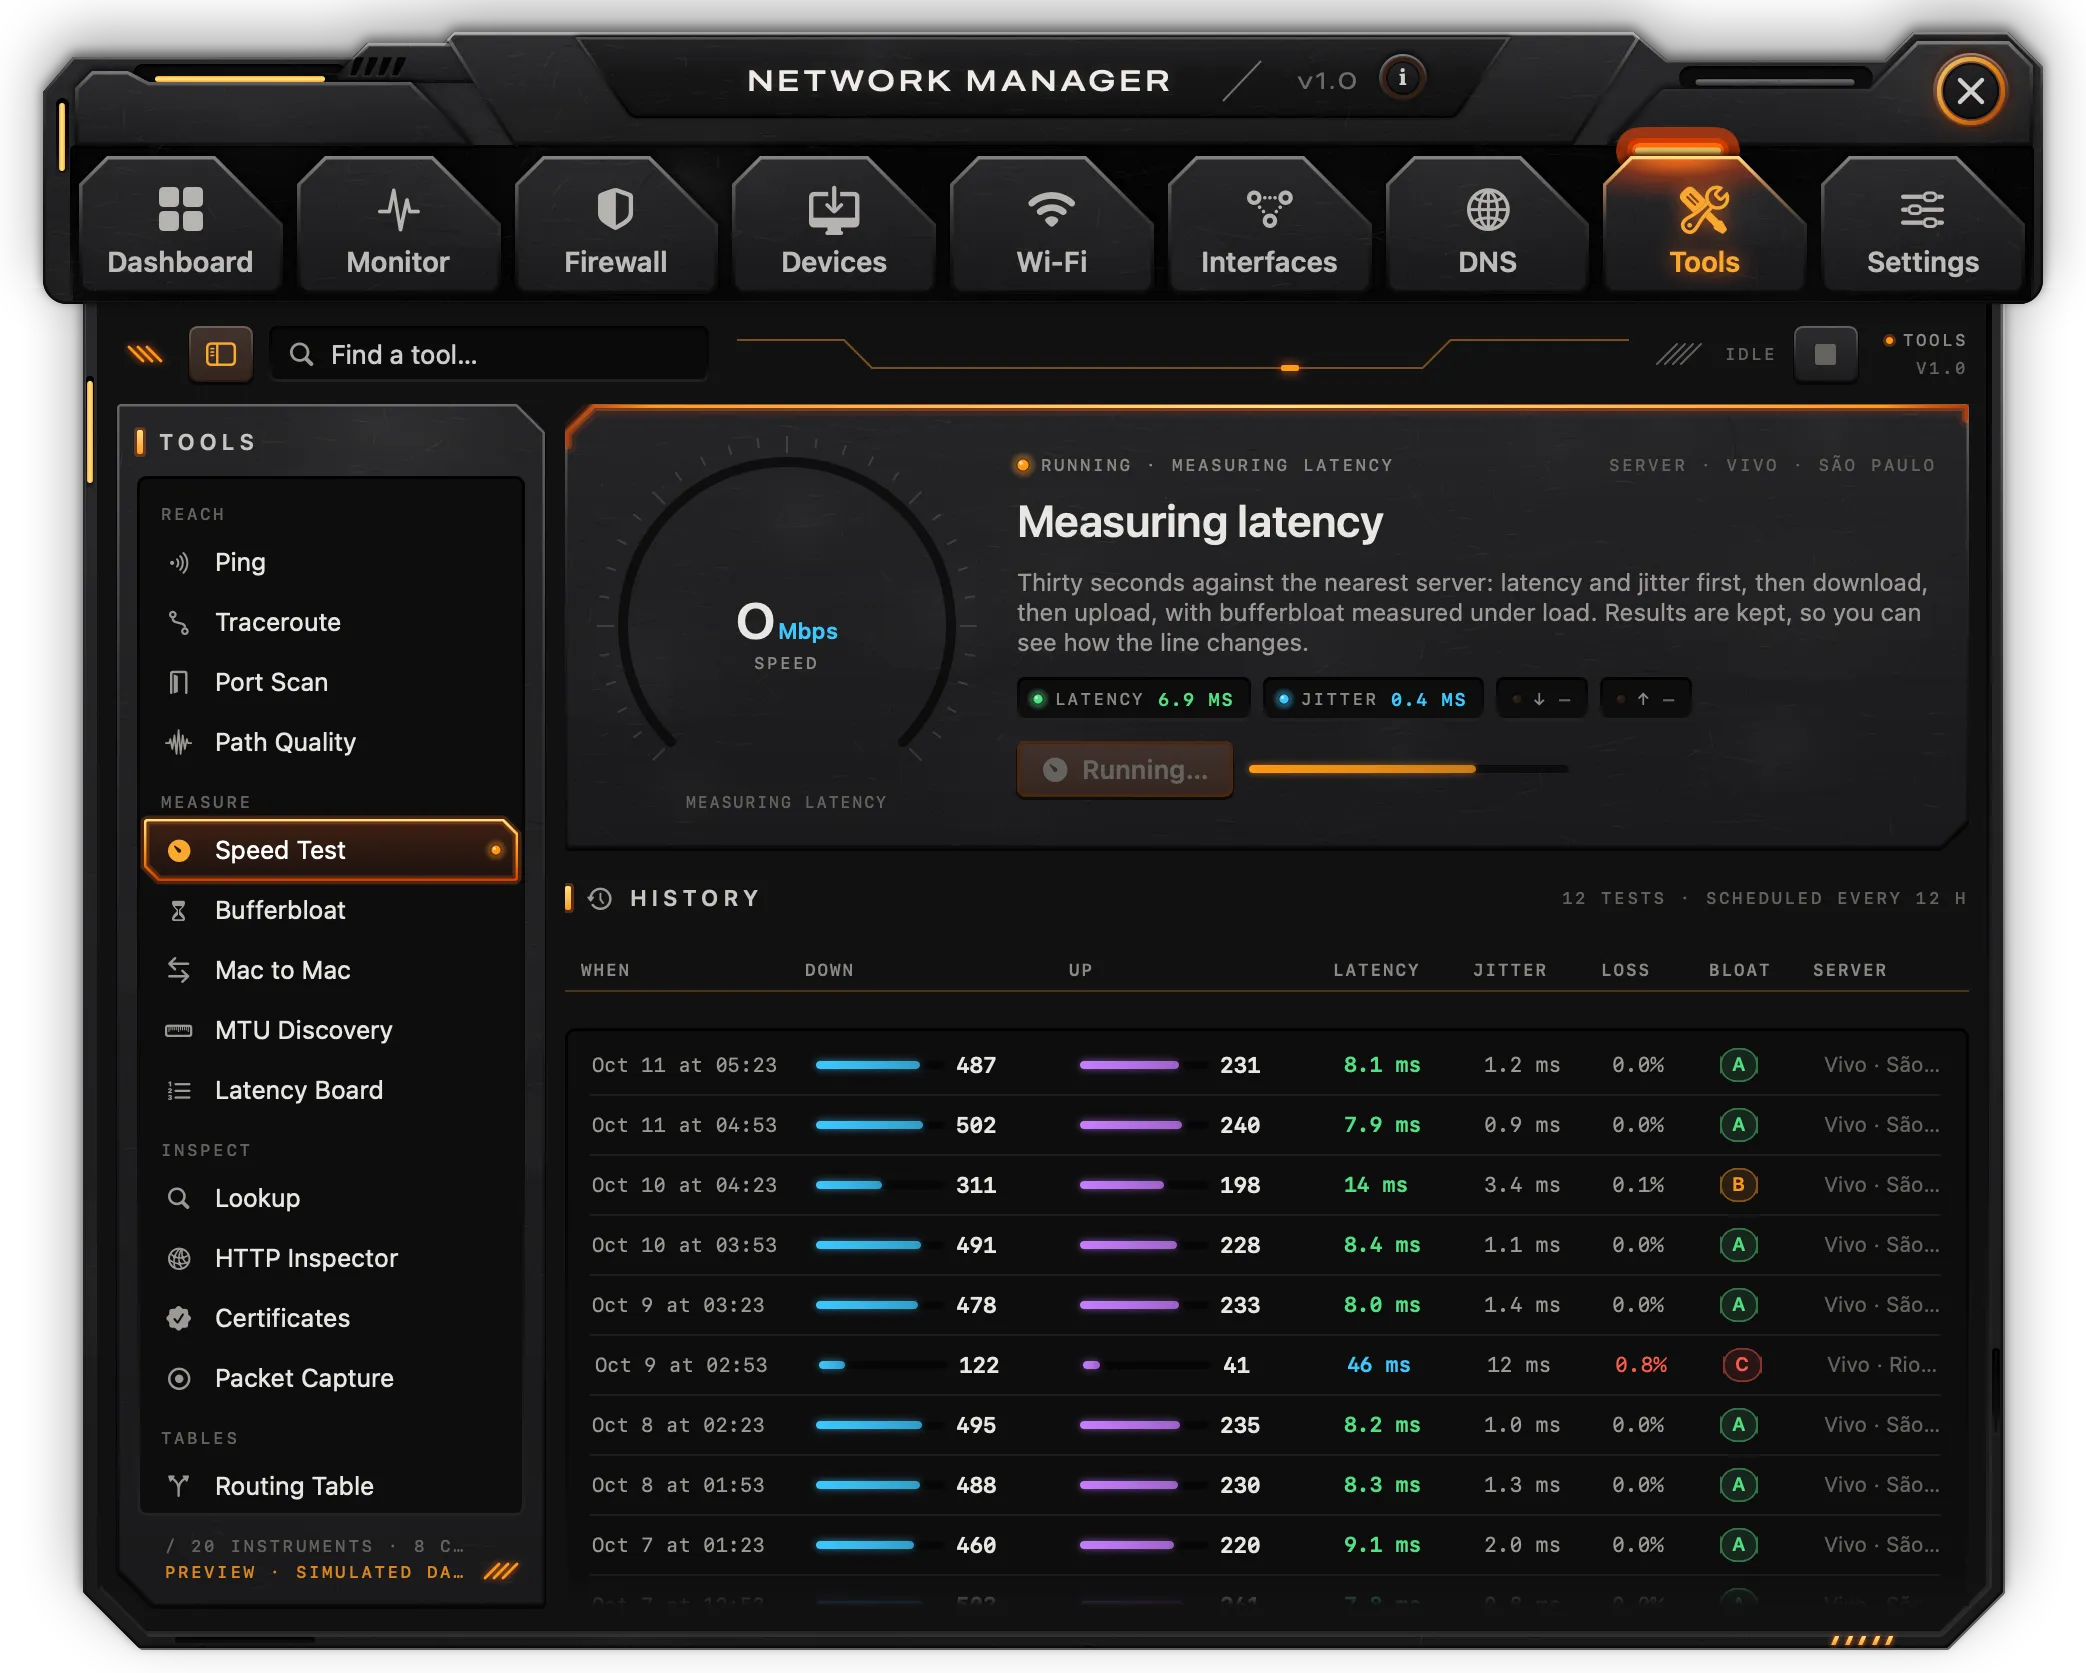
Twenty tools, grouped in the sidebar: Reach, Measure, Inspect, Tables and Utilities, then Runs by itself (Health Checks, Automations, Reports). The filter field finds a tool by name or description. The toolbar shows how many tools are running and a button to stop them all (Stop every tool).
Using a tool
Tools that take a target have a field (with an example as placeholder) and a run button; ⌘Return or Return in the field runs it, and Recent offers the last eight targets. Output streams into a console, colored by meaning; tools that measure latency draw it beside the console. Under the console: the number of lines, the state, the result, and Copy Output. Stop ends a running tool; Clear empties the console.
Other tabs open tools with a target already filled in, for example Look up, Trace, Ping and Port scan in the inspectors.
Reach
- Ping: 20 pings, half a second apart, then answered, loss, average and jitter.
- Traceroute: every hop (up to 30, one probe each), with its latency and, with the location database, where it is.
- Port Scan: TCP connections to ports 1 to 1024, or a range or port given after a comma (
192.168.1.20, 1-1024,example.com, 443); lists the open ports with their usual service. - Path Quality: a traceroute, then 30 pings to the host.
Measure
- Speed Test: see below.
- Bufferbloat: pings 1.1.1.1 for 4 seconds idle, then for 8 seconds during a download from Cloudflare, and grades the rise in latency from A+ to F.
- Mac to Mac: not in this version; it needs Network on the other Mac too.
- MTU Discovery: pings with the don't-fragment bit, searching payloads from 1200 to 1472 bytes, and reports the path MTU.
- Latency Board: three pings each to the router, 1.1.1.1, 8.8.8.8, 9.9.9.9, apple.com, google.com, github.com, cloudflare.com, amazon.com, microsoft.com and leonardoaguiar.com, sorted by latency.
Inspect
- Lookup: A, AAAA, CNAME, MX, NS and TXT records of a name (or the reverse name of an address), where it is, and the main WHOIS lines.
- HTTP Inspector: a request to a URL following redirects, with the response headers, status, size, server address and the time of DNS, connect, TLS, first byte and total.
- Certificates: a TLS handshake with
hostorhost:port(443 by default): protocol, cipher, key exchange, ALPN, whether the chain is trusted by this Mac, and for each certificate its subject, issuer, dates (with days left), SHA-256 fingerprint and, for the first one, its names. - Packet Capture: 60 packets on the primary interface with
tcpdump, with an optional filter (port 443,host 192.168.1.20). macOS asks for an administrator password each time. The packets are shown in the console, not saved to a file.
Tables and Utilities
- Routing Table and ARP Table: the system's tables (
netstat -rn,arp -an). The ARP table needs Local Network access. - Wake-on-LAN: sends a magic packet for a MAC address to the local network's broadcast address.
- Subnet Calculator: network, mask, wildcard, broadcast, first and last host, host count and class of an IPv4 CIDR.
- MAC Lookup: the maker of a MAC address from a built-in list of common makers, and whether it is a private (randomized) address.
- Public IP: the public IPv4 address and Cloudflare location from
cloudflare.com/cdn-cgi/trace, the network that owns it from Team Cymru's DNS, and the public IPv6 address if there is one. It also fills in the public address shown on the Dashboard and the map. - Captive Portal: asks
captive.apple.comand says whether a sign-in page is in the way.
Speed Test
Run Speed Test measures against Cloudflare: first latency and jitter, then 10 seconds of download and 8 seconds of upload, drawn as it goes. The result goes into History with the date, download, upload, latency, jitter and server. History lasts until the app quits; the test runs only when you start it (the "scheduled every 12 h" caption doesn't apply in this version). Bufferbloat has its own tool.
Health Checks
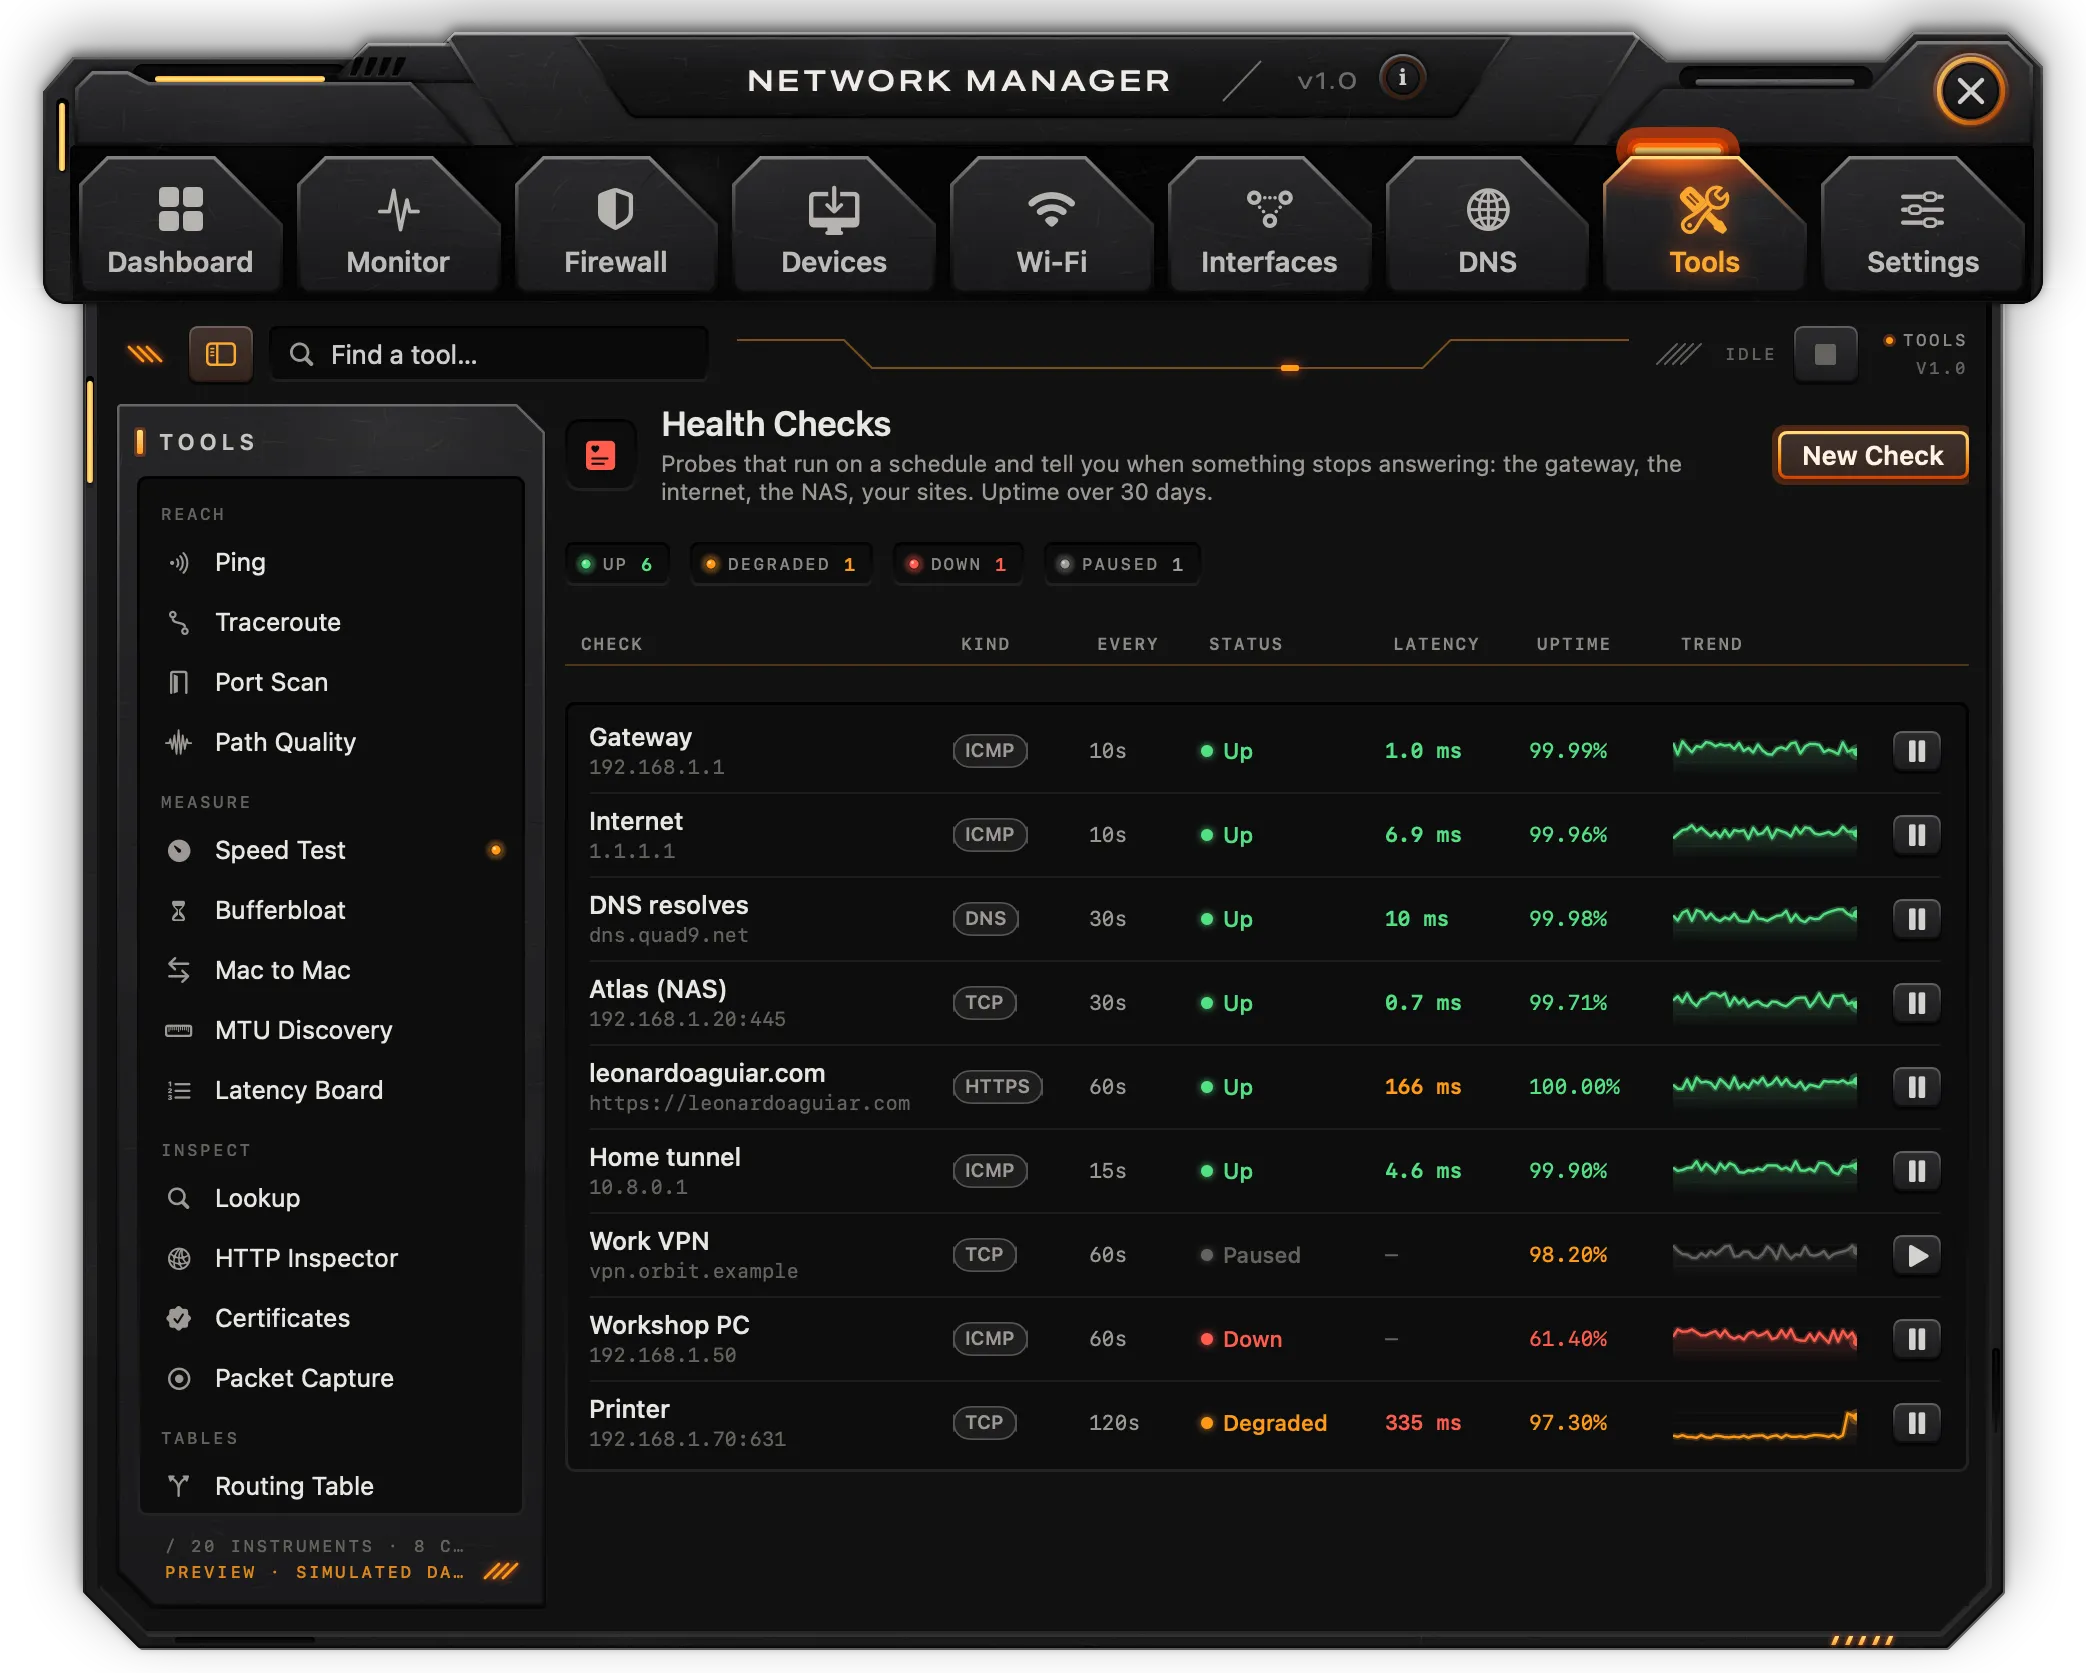
Probes that run about every 30 seconds: Gateway, Internet (Cloudflare) (1.1.1.1), Google DNS (8.8.8.8) and leonardoaguiar.com, each pinged twice. Each row shows the kind, interval, status (Up, Degraded above 250 ms, Down, Paused), latency, uptime over the last 40 runs and a trend. The button at the end pauses or resumes a check. New Check adds a check to example.com; checks can't be edited in this version.
Automations and Reports
Automations is a preview: the automations listed are examples, switched off when the app reads this Mac, and Run Now only logs a run.
Reports summarizes the network since the app started: apps on the network, traffic today and this month, the highest rate seen, the median latency to the router, the uptime of 1.1.1.1, new devices, the top five apps, unwanted servers seen, and what is worth a look (unsigned processes on the internet, ports open to every network, latency peaks, unanswered pings). Export PDF, the weekly report switch, Open Last Report and Reports Folder don't work in this version.
Settings
Settings is a single page of sections.
Data Source
- What the app reads: This Mac reads the system; Sample data shows every screen over made-up data and reads nothing from the Mac, to see what later features will look like. Switching resets what the app holds in memory (rules, devices, names) and starts over from the chosen source.
- Real in this version and Still to come: what reads the Mac today and what waits for the network extension.
- Location database: where each server is, for the map, the dossier, traceroute and lookups. Choose Country (about 10 MB) or City (about 130 MB) and click Download. The file is DB-IP Lite (CC BY 4.0) from db-ip.com, this month's edition or the previous one; it is checked, then looked up on this Mac only. db-ip.com serves it at a few KB/s, so the country edition takes a while and the city one much longer; progress shows beside the button and the download continues in the background while the app runs. Once installed, the row shows the edition, build date and size, with Update and Remove.
General and Menu Bar
- Launch at login: starts Network in the menu bar when you log in. On by default. Only available for the copy installed in Applications.
- Check for updates automatically (with Check Now) and Install updates automatically: see Updates below.
- Send anonymous usage statistics: see Usage statistics and privacy below.
- Show icon in the menu bar: hides or shows the icon. With the icon hidden, the window opens each time the app starts; open Network again from Spotlight or Finder to get the window back.
Alerts & Notifications
- Connection alerts open at: Top right, Center or Near pointer. Applies to the connection alert.
- Alert sound, Unanswered alerts time out after, Notify about new devices, Notify about denied connections, Notify about Wi-Fi changes and Notify about latency and outages are saved but have no effect in this version.
Monitoring & Privacy
- Show loopback connections: shows connections from the Mac to itself (127.0.0.1) in the Monitor. Off by default.
- Animate the map: arcs move on the Monitor's map. Off keeps the map still.
- Keep the connection log for, Record hostnames, Locate servers (with Update Database), Scan the network every and Monthly data cap are saved but have no effect in this version. The location database is managed under Data Source.
Content Inspection
Content inspection (decoding the TLS of chosen apps through a local proxy with its own root certificate) needs the network extension and is not available in this version. The switch, Install… / Remove… for the root certificate and the list of inspected apps don't install a certificate or route any traffic; when the app reads this Mac, inspection shows as off and the certificate as missing.
Permissions
- Network filter: Later.
- Local Network: Asked on scan.
- Location: Granted or Not granted, with Allow… to ask.
- Administrator: On demand.
See Permissions under Getting started.
Data
- Your configuration: counts of rules, profiles, blocklists, known devices and automations. Show in Finder opens
~/Library/Application Support/Network Manager(not available with sample data). Export… and Import… don't work in this version. - Start over: Clear Log… removes the events and DNS queries; Erase All… also removes the rules and automations. Both ask you to type
DELETE. Your settings stay.
Troubleshooting
Devices is empty. macOS hides the ARP table until Local Network access is allowed. Click Scan Now and allow it when asked. If you declined, turn Network on in System Settings › Privacy & Security › Local Network, then scan again. Tools › ARP Table is empty for the same reason.
The Wi-Fi network has no name ("Wi-Fi network (name needs Location)"). Open Settings › Permissions › Location and click Allow…, or turn Network on in System Settings › Privacy & Security › Location Services. Then click Scan in Wi-Fi to refresh the networks around.
Servers show as Unknown and the map is empty. Download the location database in Settings › Data Source. The map places this Mac from its public address: run Tools › Public IP once.
The location database download is very slow. db-ip.com sends it at a few KB/s. The country edition is the faster choice; the download continues in the background while Network runs. If it fails, the message shows in the row; click Download again.
The public address and provider show "-". They are looked up only on request: run Tools › Public IP, the speed test or a leak test. These need the internet and talk to Cloudflare and to Team Cymru's DNS.
A DNS change, lease renewal, location switch or interface change didn't happen. Each asks macOS for an administrator password; if the prompt is cancelled or the password is wrong, nothing changes and an event in the Dashboard's Activity says so ("DNS unchanged", "Lease not renewed", "Location unchanged"). Flush DNS without the password clears only the directory service cache.
Packet capture says "Cancelled." The administrator prompt was dismissed. Capture needs it every time.
Deny and the kill switch don't block anything. The firewall doesn't filter in this version; filtering needs the network extension, which comes through the updater.
Rules, device names and other changes are gone. In this version they are kept until the app quits, and switching Settings › Data Source also resets them.
A connection's dossier says a socket started earlier than it did. Sockets that were already open when Network started are dated by their process, because macOS doesn't report when a socket opened.
The menu bar icon is gone. It was hidden in Settings › Menu Bar. Open Network from Spotlight or Finder to get the window, then turn Show icon in the menu bar back on.
Network starts at login. That is the default, so the monitor keeps running. Turn off Settings › General › Launch at login, or remove it in System Settings › General › Login Items.
Mac to Mac says "Not in this version." That tool needs Network on the other Mac and comes later. Use Speed Test for the line and Path Quality for the path.
With the other Mac apps
Workspace, Manager, Clipboard and Network work as one when more than one is installed.
- Stacked windows: with more than one of their windows open, they sit together in one stack. The app menu › Stack Windows picks how, for every app at once:
- Compact (the default): the app in use shows its whole bar at the bottom of the stack with its page under it, and the others shrink to strips above it, each with its icon, name, tabs and close button. A tab on a strip opens that page and brings that app into use.
- Full Bars: every bar whole, one under the other; the app with a page open goes last, its page under it.
- Accordion: every bar whole, in the order they opened; a page opens under its own bar and pushes the bars below it down.
- Separate Windows: each window on its own, where you put it.
- In every stacked mode one page is open at a time: opening a tab in one app folds the other's page. Dragging any bar or strip moves the whole stack; closing a window closes the gap, and the last one left takes the top of the stack.
- One search: Search also finds what the other installed apps have (their pages, settings and actions), listed under In and the app's name; picking one opens it in its app, launching it if it isn't running. What you made or copied (pinboards, snippets, layouts, sessions, the apps you copied from) stays out. Each app keeps the list of what can be found in it in
~/Library/Application Support/leonardoaguiar.com/search/, on this Mac only. - About shows the other apps, with Open for those installed and Get It for the others, which opens their page on leonardoaguiar.com.
Updates
Network checks leonardoaguiar.com for a new version once a day. This is on from the start; turn it off in Settings › Check for updates automatically.
- The small square button with two arrows on the bar, right of the i, checks for updates when clicked. While a new version is waiting, it lights orange with a lamp at its corner, and its tooltip names the version.
- Check for Updates… in the app menu does the same.
- Install updates automatically (off until you turn it on) downloads updates in the background and installs them when Network quits, or right away from the notice it shows.
- Every update is signed by the developer and refused if the signature doesn't match.
Help and bug reports
The Help menu and the Help plate on About have:
- Network Documentation (also Documentation in the app menu): this page.
- Changelog: every version and what changed in it, read from leonardoaguiar.com, so it includes versions newer than the one installed. The installed version is marked, and a newer one comes with Update Now. The same list is at leonardoaguiar.com/network/changelog.
- Report a Bug… (also in the app menu, under Check for Updates…): a form that sends a report to the developer.
Report a Bug
| Field | What goes in it |
|---|---|
| Kind | Bug, Crash or Suggestion. |
| How often | Every time, Sometimes or Once (not for a suggestion). |
| Title | A few words about the problem, up to 140 characters. |
| What happened | What you were doing and what you saw (for a suggestion: what you'd like the app to do). |
| Steps to reproduce · optional | How to make it happen again, one step per line. |
| What you expected · optional | What should have happened instead. |
| Email · optional | To hear back by email; never published or shared. |
| Attachments | Up to 5 files of up to 10 MB each: drop them on the field or click Add Files…. Screenshots, screen recordings and logs help the most. |
| Include system information | On by default: the app's version and build, the macOS version, the Mac's model, processor and memory, and the language. Show displays exactly what goes. |
Send Report (⌘↩) is ready once there's a title and a description; until then the line beside it says what's missing. It sends everything as one report and shows its number; Clear empties the form. Sending takes a moment of the Mac's work first, which keeps the site from being flooded with automated reports.
Your Reports
The reports sent from this Mac are listed next to the form, with their status - received, confirmed, in progress, fixed (with the version that fixes it) or closed - and an orange lamp when there's a reply you haven't read. Click a report to read the conversation and add more details. Remove from This List takes it off this Mac's list; the report stays with the developer. The list is refreshed each time the page opens, or with the button next to its title.
Usage statistics and privacy
Network sends anonymous usage statistics to leonardoaguiar.com once a day. They're on by default and help decide what to fix and improve. Settings › Send anonymous usage statistics turns them off, and whatever was waiting to be sent is discarded.
What goes: the app's version, the macOS version, the Mac's model identifier (such as Mac15,3), the processor type, the language, a few settings that are on or off (such as checking for updates on its own), how many times the app was opened, the minutes its window was open, and how many times each tab and function was used, counted per day. With it goes an identifier that is random, made by the app and used only for this.
What never goes: names, addresses, connections, networks or devices, files, and anything you type. The site records the country the statistics come from, not the IP address.
Besides the statistics, Network connects to leonardoaguiar.com only to check for and download updates, to show the changelog, and to send a bug report when you write one and to check its replies.